
Turtle Diagrams
Instructions for Creating a Turtle Diagram
A "Turtle Diagram" is a process improvement tool (schematic visual representation) of the key elements that make up a single process. In short, a turtle diagram is used to illustrate the 1-page plan for a single process including the resources needed to achieve the process’s purpose. Within the anatomy of a turtle diagram is the visual display of key process characteristics such as inputs, outputs (expectations), criteria (metrics) and other high-level information used to assist relevant process stakeholders in the effective execution and improvement of the process itself.
You can get our free Turtle Diagram Mini Book by signing up here.
While there is no requirement for the use of turtle diagrams per ISO 9001, ISO 14001, IATF 16949 or other international standards, many organizations who use turtle diagrams are doing so in order to meet management system requirements. Turtle diagrams can replace various multi-page, complex documented procedures (that few associates read in the first place), and instead provide a clear visual illustration of what is expected from a process. This tool can also work as a contract between cross-functions, illustrating where product, communication, and other hand-offs begin and end.
18 Pre-filled Turtle Diagrams + Workshop Slide Deck
This bundle includes 18 editable pre-filled turtle diagrams applicable to the most common business processes. Each complete turtle diagram includes key inputs, outputs, resources needed, suppliers, customers, and metrics (PPIs) based on decades of auditing and implementation projects.
Turtle diagrams are a great starting point for significant process improvements, when constructed by their respective stakeholders. The fields for 1. process, 2. key outputs and 3. criteria belong to the process stakeholders, with ultimate responsibility resting with the assigned Process Owner. By assigning process ownership, the organization establishes clear expectations for the process owner and other members of the process team. Conversely, fields for 4. who, 5. what, 6. inputs and 7. how to define the resources needed by the process team in order to achieve the desired results expected. Using this approach to process management, the turtle diagram can serve as a “contract” between the Process Owner and leadership of the organization. If expectations (outputs) change, then there should be consideration given to respective resources needed to meet these new expectations. And as resources change (i.e. Chief Engineer will be retiring next year), there should be consideration given to what is expected from the process outputs.
This discussion will guide you in creating an accurate turtle diagram by defining the expectations for each box within the process map.
Simple Turtle Diagram Template
You can get our free Turtle Diagram Mini Book by signing up here.
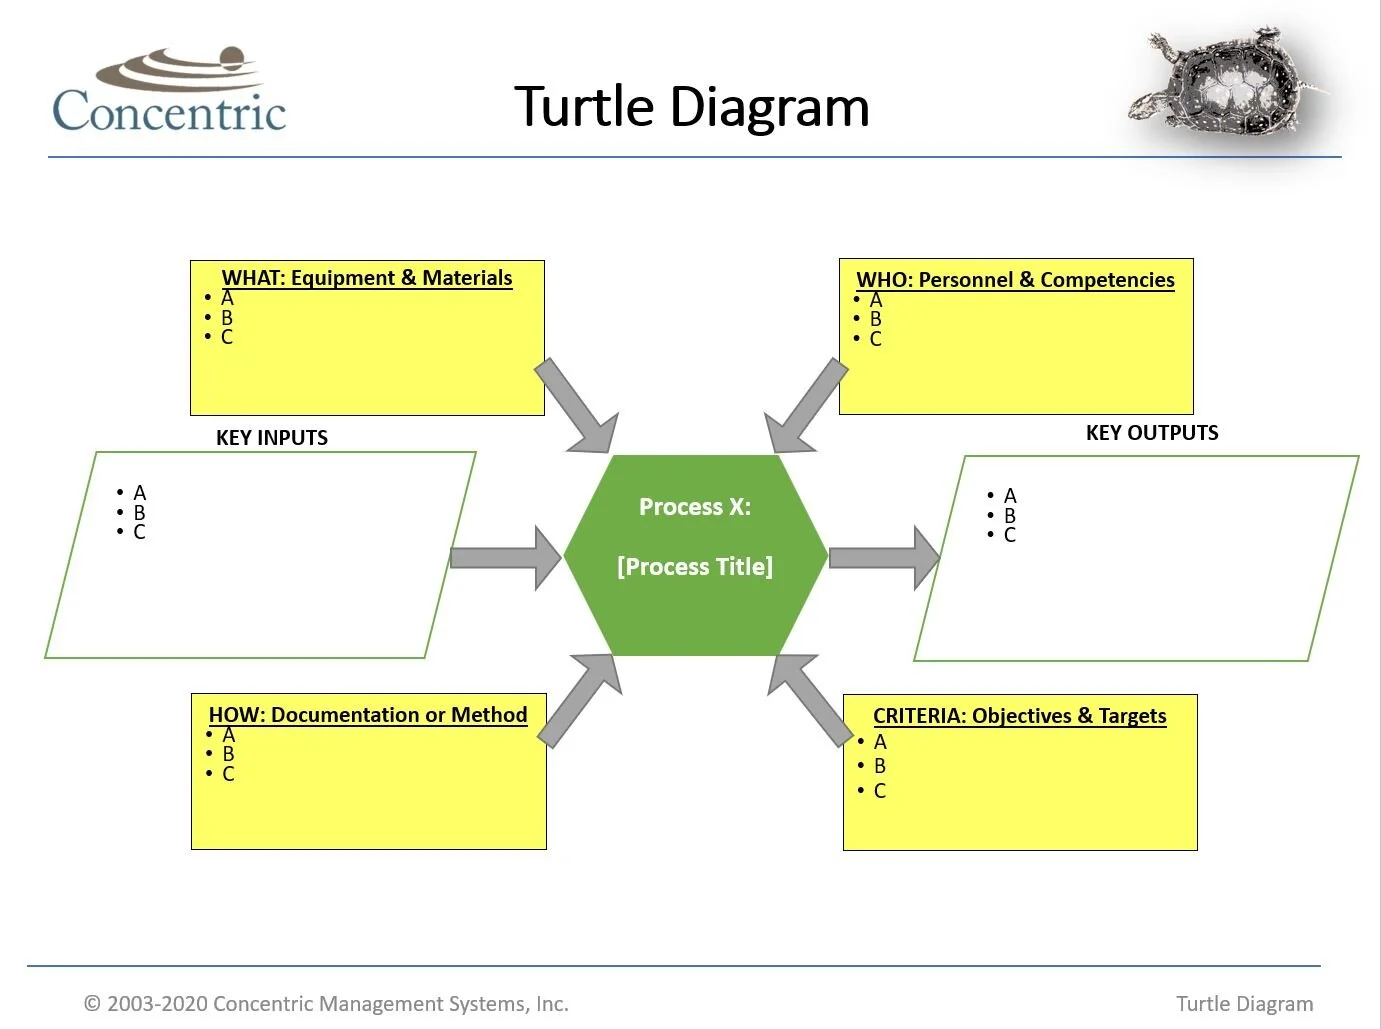
The primary lane for the turtle diagram contains information for the key inputs, key process steps and key outputs.
Inputs - Enter details of the actual process input such as key information, reports, components, materials, schedules, requirements or other information. Inputs come from suppliers; some external suppliers but most frequently internal suppliers.
Process - Enter the name/title of the process being described. Some groups choose to list the top 2-5 activities that occur within this particular process (i.e. load oven, bake donuts, unload donuts).
Outputs - Enter details of the actual desired process output such as the advanced-stage product, updated documents, inventory transactions, completed records, etc. linked to an actual measure of effectiveness.
18 Pre-filled Turtle Diagrams + Workshop Slide Deck
This bundle includes 18 editable pre-filled turtle diagrams applicable to the most common business processes. Each complete turtle diagram includes key inputs, outputs, resources needed, suppliers, customers, and metrics (PPIs) based on decades of auditing and implementation projects.
The secondary lanes for the turtle diagram contains key resources that are needed in order to achieve the desired expectations (outputs).
What: Equipment & Materials - Enter details of the key machine, materials, test equipment, computer systems, software, etc. used in the process.
Who: Personnel & Competencies - Enter personnel requirements, including special skills, competencies, certifications, licenses, training requirements, restrictions, etc.
How: Documentation or Methods - Documentation/Methods - Enter additional documentation such as key standard operating procedures (SOPs), work instructions (WIs), set-up illustrations, checklists or other specific methods to reference (i.e. GAAP, Employee Handbook, owners manual), etc.
Criteria: Objectives & Targets - Enter measurable objective and targets associated with the process outputs such as effectiveness, efficiency or budget measures (i.e. % of good parts, % of schedule attainment, $ actual vs. budget, etc.).

Turtle Diagram Example based on the Baking Process at Ted’s Fat Free Donuts, Inc.
If you would like to learn more about how you can use Turtle Diagrams for change management, risk-based thinking, exploring opportunities for improvement or for use in auditing, check out part II of this blog titled SIPOC vs. TURTLE.
18 Pre-filled Turtle Diagrams + Workshop Slide Deck
This bundle includes 18 editable pre-filled turtle diagrams applicable to the most common business processes. Each complete turtle diagram includes key inputs, outputs, resources needed, suppliers, customers, and metrics (PPIs) based on decades of auditing and implementation projects.