
BLOG

Introducing the Super Turtle Diagram
This editable bundle contains various templates, examples and instructions that are simple to understand and configure yourself. Included are the Turtle Diagram template, the Swimlane Diagram, the SIPOC Diagram, the Tu-Poc Diagram and the new Super Turtle Diagram. Additional templates are added to illustrate how process teams can use these diagrams to analyze risks, the effect of changes on process outputs, resources needed to achieve desired results, process oriented metrics, and more.

SIPOC Diagrams VS Turtle Diagrams
The SIPOC diagram stands for Supplier Input Process Output Customer. Like the turtle diagram, the SIPOC is a schematic representation of the elements of a single process - starting with the supplier and ending with the customer.
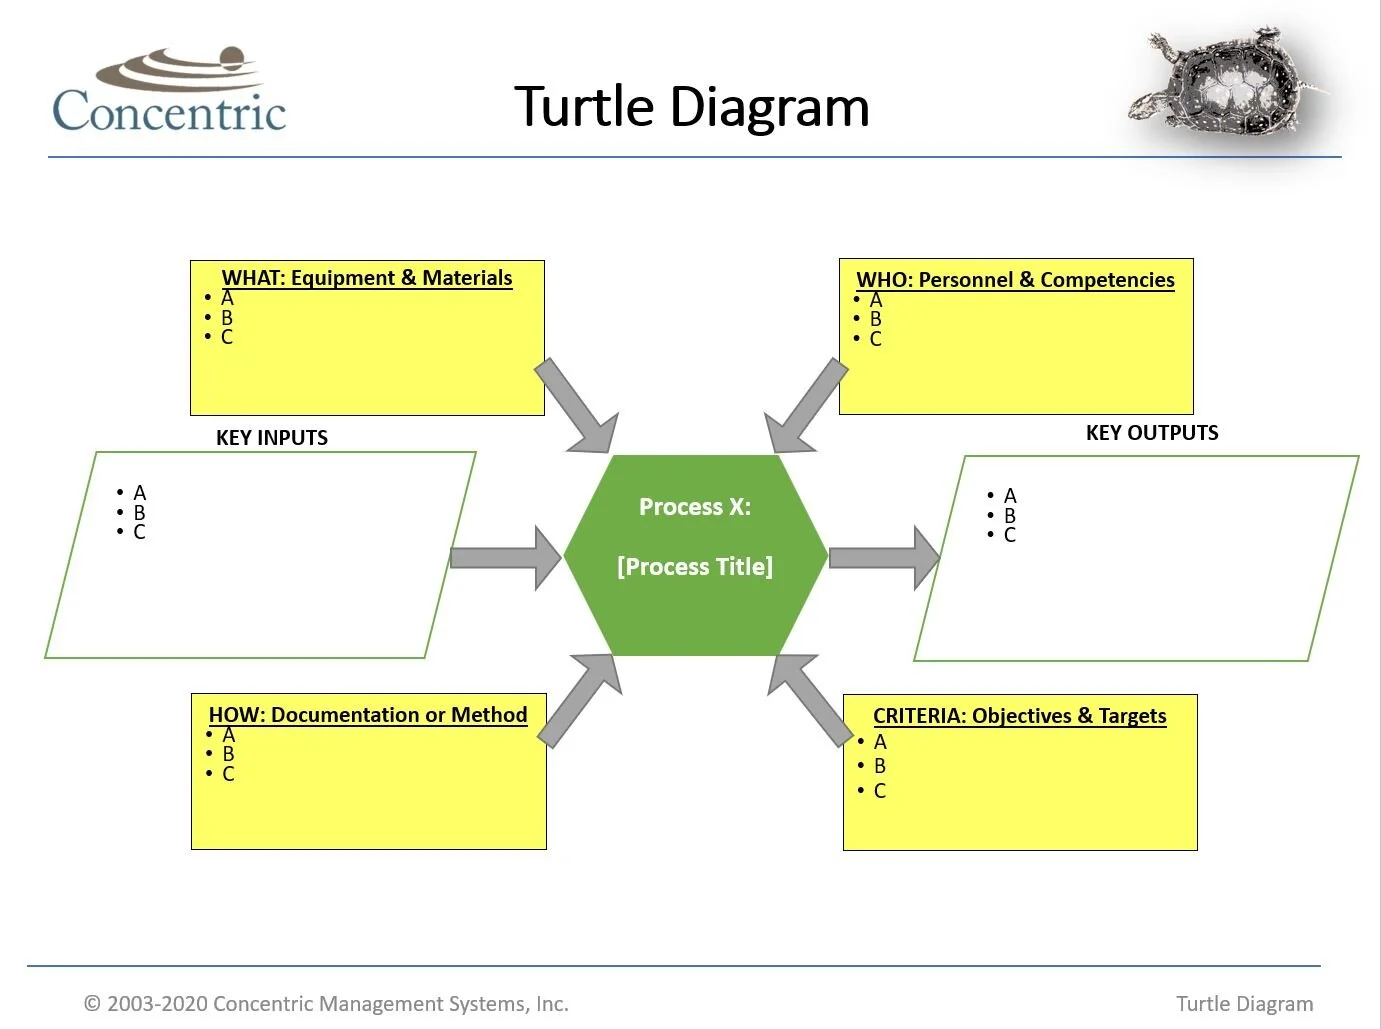
Turtle Diagrams
A "Turtle Diagram" is a quality tool used to visually display process characteristics such as inputs, outputs (expectations), criteria (metrics) and other high-level information to assist in the effective execution and improvement of key business processes.
