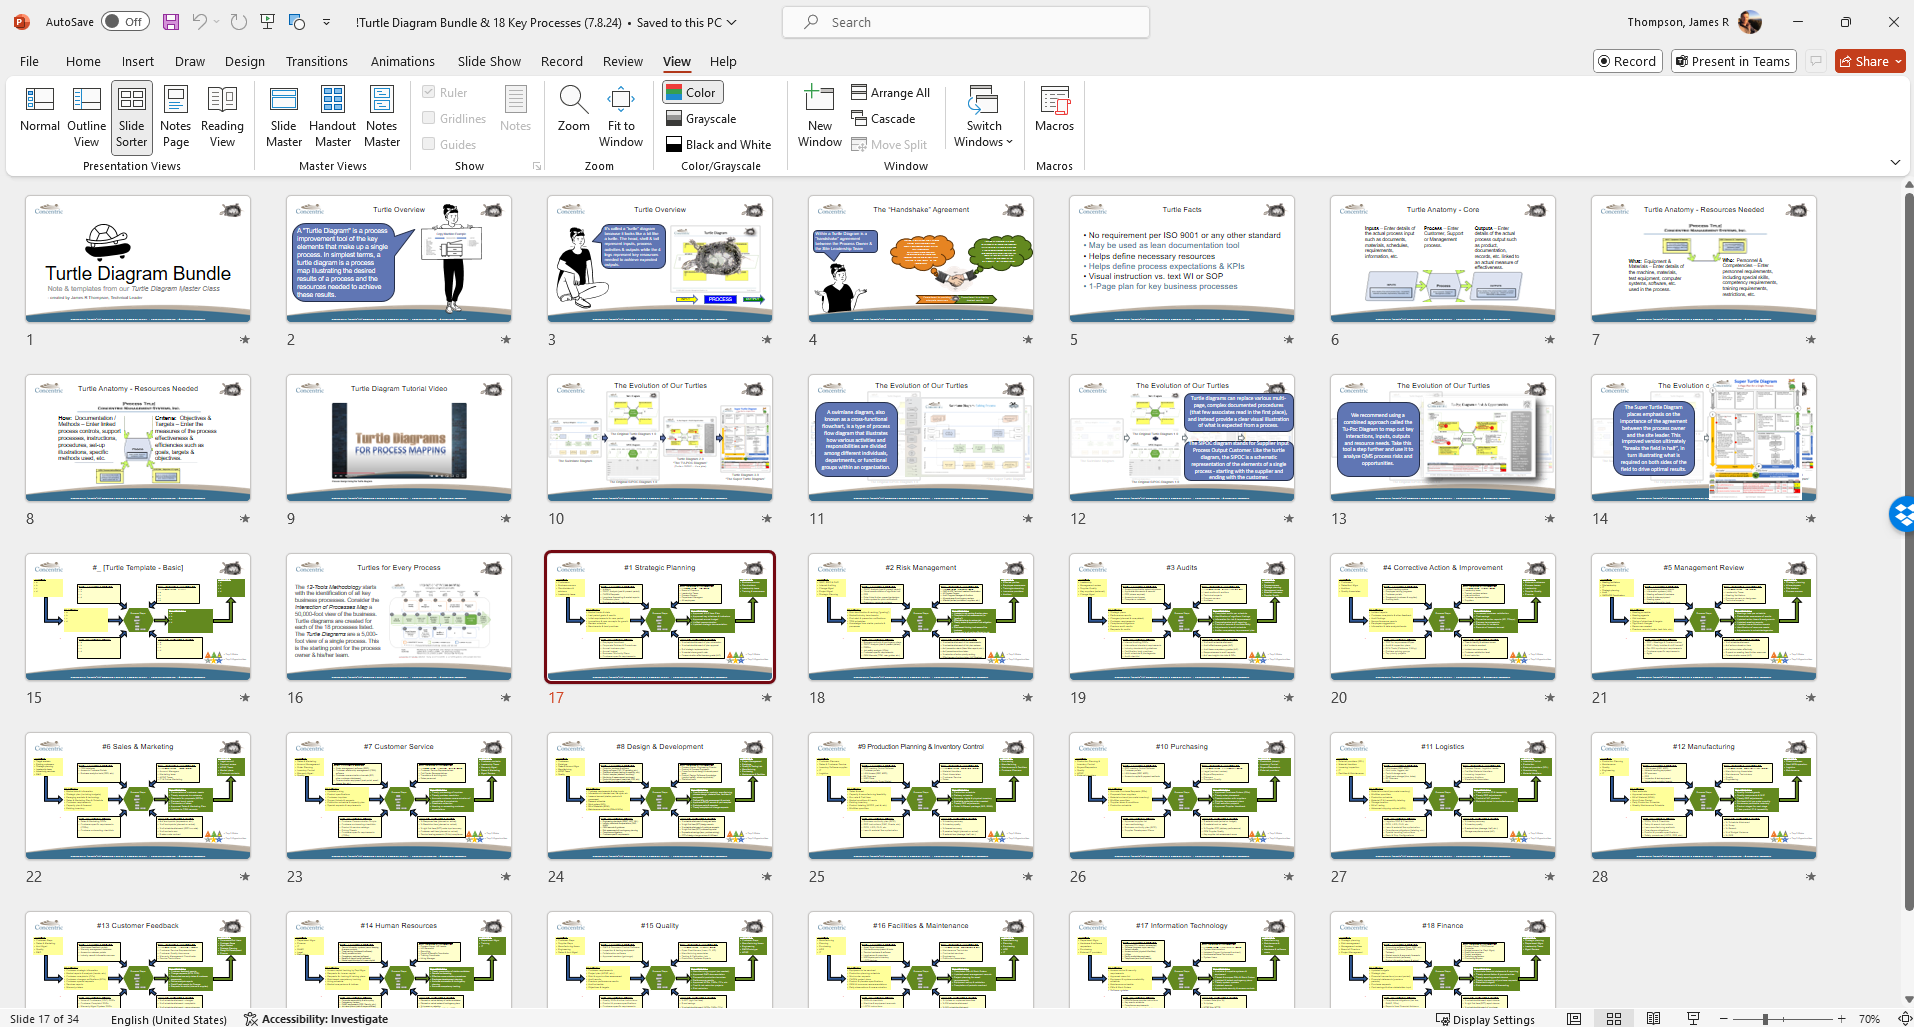
This editable PowerPoint file contains various templates that are simple for you to choose and configure yourself. Included are the Turtle Diagram template, the SIPOC Diagram, and the new Tu-Poc Diagram. Additional templates are added to illustrate how process teams can use these diagrams to analyze risks, the effect of changes on process outputs, resources needed to achieve desired results, process oriented metrics, and more.
COMPLIANCE: These tools can be used to satisfy requirements for clauses 4.4, 6.1 and dozens of others.
For years, process owners and quality practitioners have found themselves in a bit of a “gang war” between The Turtles and The SIPOCs. This topic has been a hot one. Do organizations map their processes use a turtle diagram or a SIPOC diagram? Why choose? We've found the answer… The Tu-Poc Diagram!
We recommend using the Turtle Diagram... although "The SIPOCs" would strongly disagree. The need for the gang wars between "The Turtles" and "The SIPOCs" are over!
We recommend using a combined approach called the Tu-Poc Diagram to map out key interactions, inputs, outputs and resource needs. Take this tool a step further and use it to analyze QMS process risks and opportunities. Using the space at the top just above PROCESS, you can add any of these that are related to the specific process at hand:
Top risks & opportunities of the process
Customer-specific requirements pertinent to the process
Environmental targets & objects
Health & safety targets & objectives
Process budgeting/financial resource requirements
Known or likely causes of poor quality
Be creative. Its YOUR process(es) so have a little fun with it!
Terms and conditions apply. By downloading this file, you agree to our terms and conditions.

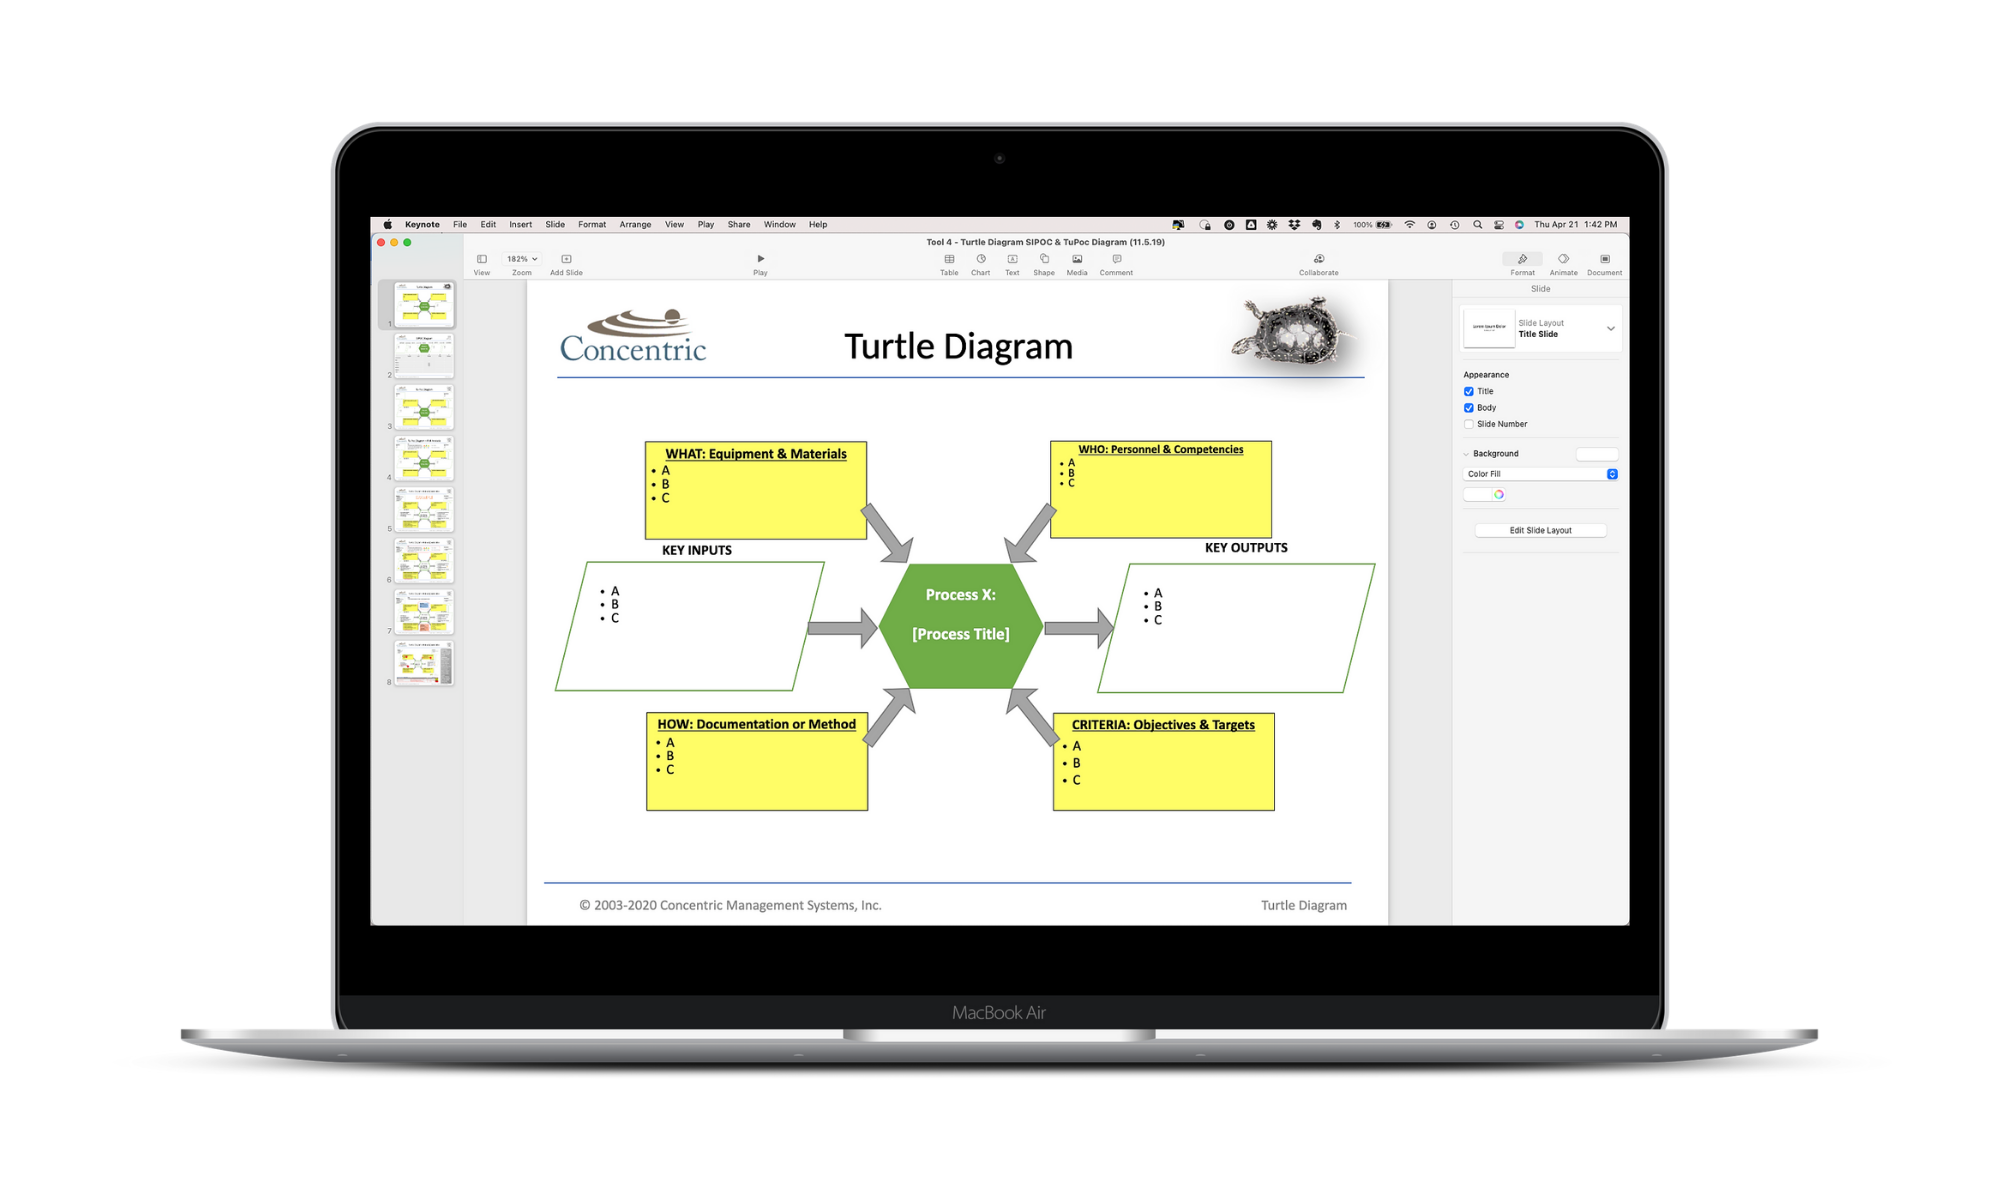 Image 1 of 7
 Image 2 of 7
 Image 3 of 7
 Image 4 of 7
 Image 5 of 7
 Image 6 of 7
 Image 7 of 7