
BLOG
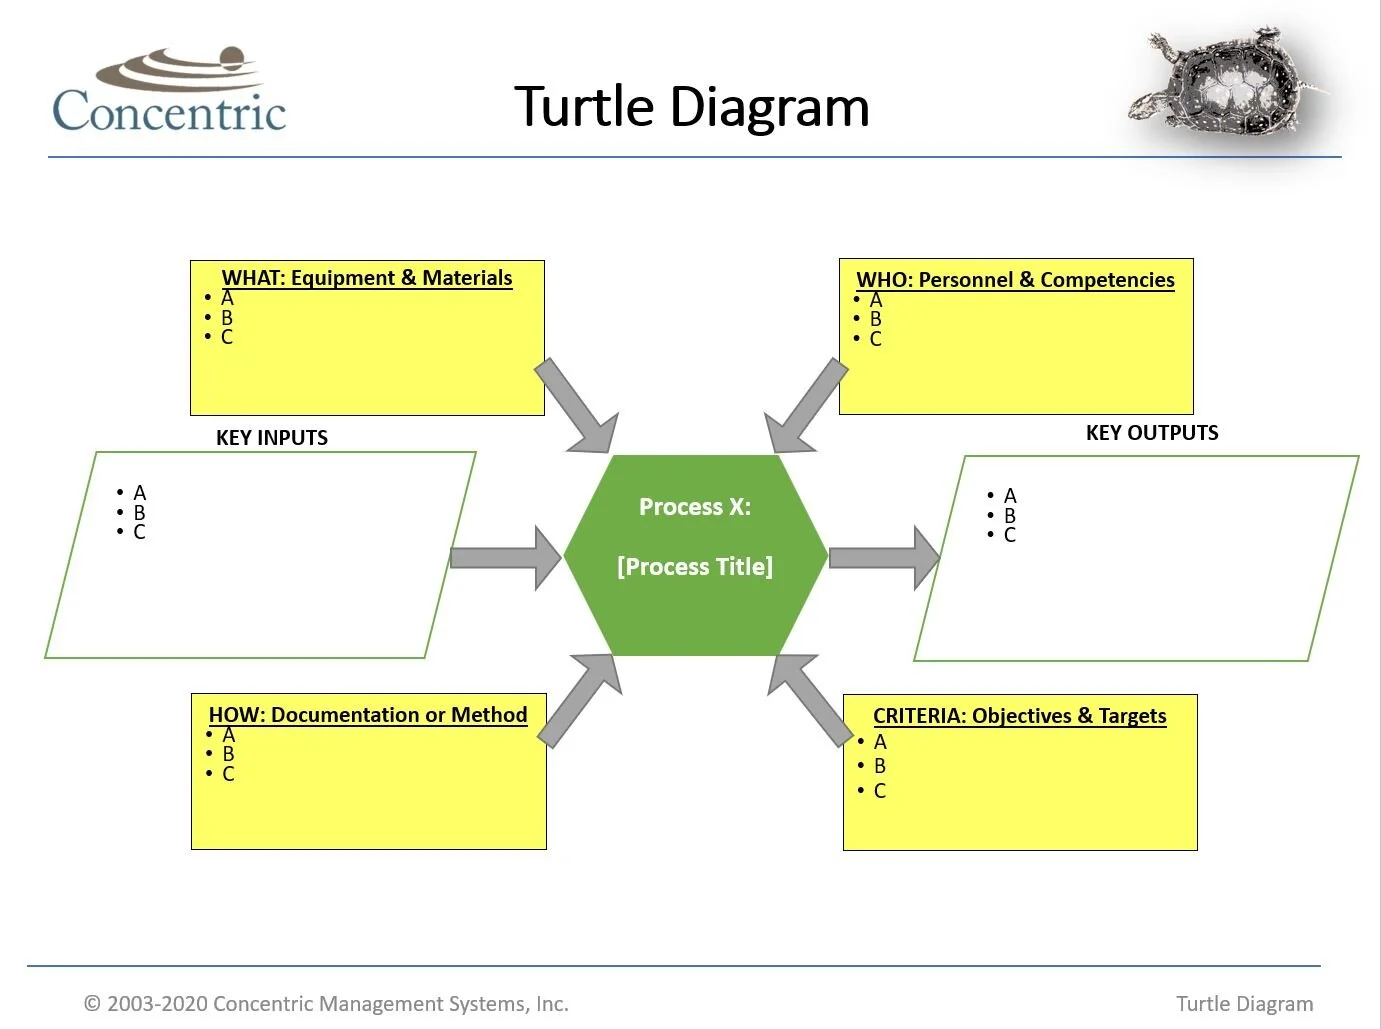
Turtle Diagrams
A "Turtle Diagram" is a quality tool used to visually display process characteristics such as inputs, outputs (expectations), criteria (metrics) and other high-level information to assist in the effective execution and improvement of key business processes.

Top Apps & Tools That Startups Swear By
Trying to get a startup business off the ground can be a scary endeavor. Apart from gathering the right people to help you fulfill your vision, gathering clientele and keeping them interested and engaged will take all of your time and effort; and because of the size of your company, every hit against your coffers has the potential to devastate your startup.

12 Tools™ for the Ultimate Management System
During my first 25+ years of working with various organizations and leadership team members, I've noticed that most struggle with the concept of a management systems or processes that make up a system. A mentor of mine once stated "No one wants to build a house. But everyone sure as hell shows up when its time to paint it." I thought that was not only really funny but also similar to building and maintaining management systems.


