Pain Point 4 – Poorly Defined Process Controls and Variation in Execution
Many organizations operate processes that are understood informally but rarely defined in a consistent, structured way. Inputs, outputs, controls, roles, and measurements exist—but not in one clear, shared view. As a result, processes feel like a black box: people know work is happening, but not always how or why outcomes vary.
Why this matters
When individual processes are not clearly defined and controlled, risks remain hidden until they surface as defects, customer complaints, or audit findings. Teams spend time reacting instead of preventing problems, and process performance varies depending on who is doing the work. From a compliance standpoint, this often leads to nonconformities tied to weak process controls, unclear responsibilities, or ineffective monitoring—particularly under standards such as ISO 9001. From a business perspective, it results in inefficiency, rework, higher costs, and difficulty scaling.
The better way
A simple, one-page process definition that makes the critical elements of work visible and understandable. By clearly documenting:
Inputs and outputs
Roles and responsibilities
Controls and supporting resources
Performance measures
processes become repeatable, predictable, and improvable. Risks are identified earlier, variation is reduced, and audits become a validation exercise rather than a discovery mission.
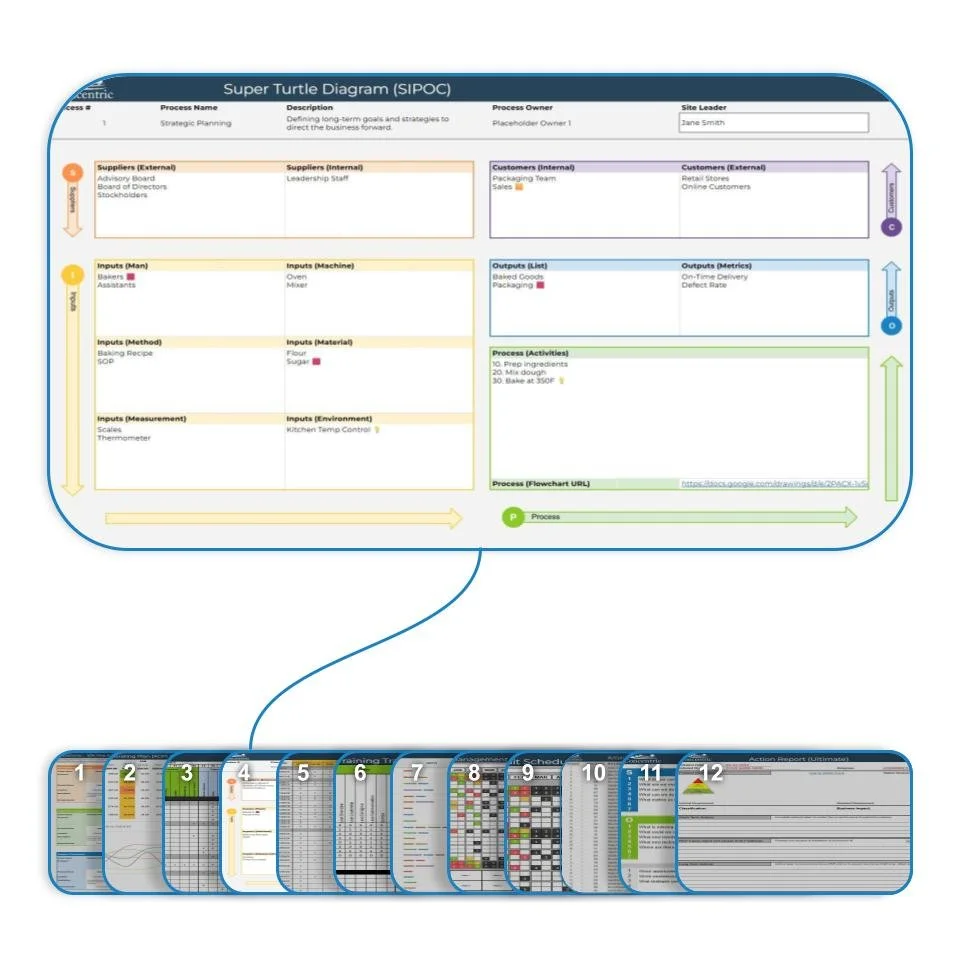
Tool 4: Turtle Diagram (5K Process Map)
The Turtle Diagram (5K Process Map) provides a focused, structured view of an individual process. Using a clear, visual format, it captures everything needed to control and manage a process on a single page—what is done, who does it, with what inputs and resources, under what controls, and how performance is measured.
Implemented in a flexible, spreadsheet-based format, the tool balances visual clarity with data-driven structure. It is easy to maintain, link to supporting documents and metrics, and integrate with downstream tools such as audits, risk assessments, and performance dashboards. Refined through more than 15 years of real-world application, it enables organizations to standardize execution without adding unnecessary complexity.
This tool is where strategy and structure meet daily work.
How Tool 4 Fits into the 12 Tools™ System
The Turtle Diagram builds on the organizational clarity established in Tools 1–3 by defining how work is actually performed. It provides the operational detail required to support performance measurement, risk assessment, auditing, and corrective action. Without this level of clarity, higher-level plans and metrics lack a stable foundation.
Apply the tool to a critical process, refine it with your team, and share what you learn. The strength of the 12 Tools™ Methodology comes from consistent structure informed by real operational experience.
Other Commonly Used Tools (and Their Limitations)
SIPOC Diagram
A high-level method for identifying suppliers, inputs, process steps, outputs, and customers.
Strength: Quick way to frame process boundaries.
Limitation: Lacks detail on controls, roles, and performance measures.Lucidchart
A collaborative platform for creating custom process diagrams.
Strength: Intuitive visuals and real-time collaboration.
Limitation: General-purpose tool not structured for formal process control.Microsoft Visio
A robust solution for detailed flowcharts and process models.
Strength: High level of customization.
Limitation: Steeper learning curve and heavier administrative effort.Miro
A digital whiteboard used for collaborative mapping and workshops.
Strength: Excellent for team engagement and ideation.
Limitation: Less disciplined structure for compliance-focused process control.