
Pain Point 12 – Recurring Problems Due to Weak Corrective Action and Root Cause Analysis
Many organizations address issues quickly—but not deeply. Problems are corrected, symptoms disappear, and work moves on. Yet weeks or months later, the same issues resurface in a slightly different form. Without a disciplined approach to understanding why problems occur, organizations remain stuck in a cycle of repeat failures.
Many organizations address issues quickly—but not deeply. Problems are corrected, symptoms disappear, and work moves on. Yet weeks or months later, the same issues resurface in a slightly different form. Without a disciplined approach to understanding why problems occur, organizations remain stuck in a cycle of repeat failures.
Why this matters
When root causes are not accurately identified and corrective actions are not verified for effectiveness, problems recur. This often results in repeated nonconformities, audit findings tied to ISO 9001 Clauses 10.2 and 10.3, and growing frustration across teams. From a business perspective, temporary fixes consume time and resources without delivering lasting improvement—eroding customer confidence, increasing costs, and weakening the credibility of the management system.
The better way
A structured, repeatable approach to corrective action that focuses on eliminating problems at their source. By consistently:
Defining problems clearly
Identifying true root causes using proven methods
Implementing corrective actions tied to causes
Verifying effectiveness over time
Organizations move from reactive fixing to sustained improvement. Issues stay solved, lessons are retained, and the system becomes more resilient with every correction.
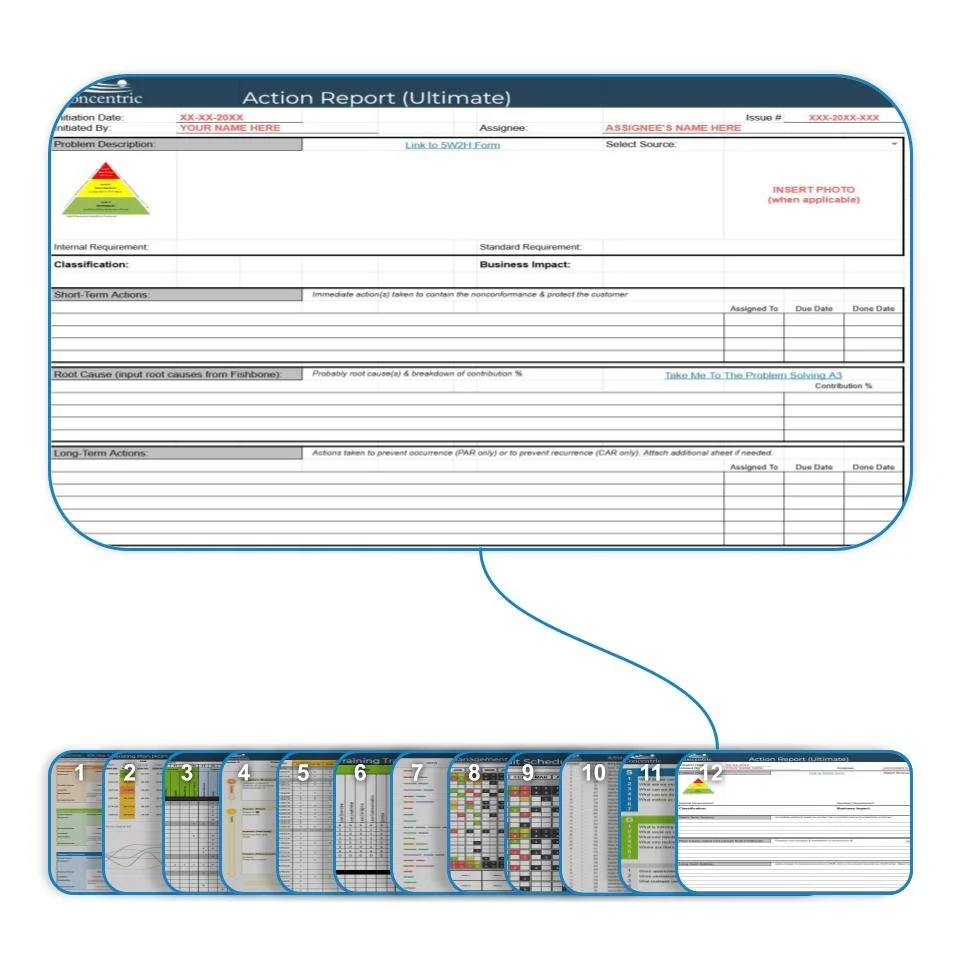
Tool 12: Corrective Action & Root Cause Analysis (RCA)
The Corrective Action & Root Cause Analysis (RCA) tool provides a disciplined framework for identifying root causes, managing corrective actions, and verifying long-term effectiveness. It guides teams through proven analysis methods—such as 5 Whys and Fishbone—and ensures actions are tracked through completion and validation.
Built in a flexible, spreadsheet-based format, the tool supports workflow tracking, ownership, due dates, and effectiveness checks in a single integrated view. It links directly to audits, risk assessments, performance metrics, and management review. Refined through more than 15 years of real-world use, it enables organizations to resolve issues permanently without unnecessary bureaucracy.
This tool closes the loop—and makes improvement real.
How Tool 12 Fits into the 12 Tools™ System
Corrective Action & RCA is the final step in the closed-loop system. It transforms insights from audits (Tool 6), performance measures (Tool 7), risks (Tools 9 and 11), and management review (Tool 8) into lasting improvement. Without effective corrective action, the rest of the system generates data—but not progress.
Apply the tool to recurring issues, validate effectiveness over time, and share what works. Practitioner insight continues to refine how this methodology evolves.
Other Commonly Used Tools (and Their Limitations)
MasterControl
A quality management platform with structured CAPA workflows and RCA tools.
Strength: Strong integration across QMS modules.
Limitation: Higher cost and system overhead.ETQ Reliance
A QMS platform offering automated corrective action workflows and verification.
Strength: Configurable and ISO-aligned.
Limitation: Setup and administration effort required.Intelex
An EHSQ platform supporting Fishbone analysis and corrective action reporting.
Strength: Scalable cloud-based solution.
Limitation: Broader scope beyond quality may add complexity.Qualio
An electronic QMS with guided CAPA and root cause workflows.
Strength: User-friendly and intuitive interface.
Limitation: More heavily oriented toward specific regulated industries.

Pain Point 11 – Inadequate Risk Anticipation and Prevention
Many organizations can identify risks, but struggle to determine which ones truly matter and how to address them proactively. As a result, prevention activities compete with day-to-day work, budgets are allocated reactively, and improvement projects are prioritized based on urgency rather than impact.
Many organizations can identify risks, but struggle to determine which ones truly matter and how to address them proactively. As a result, prevention activities compete with day-to-day work, budgets are allocated reactively, and improvement projects are prioritized based on urgency rather than impact.
Why this matters
When risks are not systematically assessed and linked to prevention planning, organizations pay for problems after they occur—through delays, cost overruns, customer impact, or audit findings. This frequently ties back to weak alignment with requirements such as ISO 9001 Clause 6.1, where risks are identified but not effectively addressed. From a business perspective, limited resources are spread thin, high-impact prevention opportunities are missed, and leadership lacks confidence that budgets are being applied where they will deliver the greatest return.
The better way
A structured approach that goes beyond identifying risk to actively preventing it. By consistently:
Assessing risks based on likelihood and impact
Defining prevention actions before issues occur
Prioritizing improvement projects objectively
Aligning budgets and resources to risk and opportunity
organizations move from reactive spending to intentional investment. Prevention becomes a strategic activity that protects performance, customers, and profitability.
Tool 11: Risk Assessment & Prevention
The Risk Assessment & Prevention tool provides a structured method for evaluating risks and translating those assessments into prioritized prevention activities. It connects risk analysis directly to decision-making around projects, resources, and budgets—ensuring effort is focused where it delivers the most value.
Built in a flexible, spreadsheet-based format, the tool supports scoring, prioritization, and prevention planning in a single integrated view. It enables organizations to compare risks objectively, evaluate trade-offs, and align improvement initiatives with strategic priorities. Refined through more than 15 years of real-world use, it helps organizations prevent issues before they become costly problems.
This tool turns risk awareness into disciplined prevention.
How Tool 11 Fits into the 12 Tools™ System
Risk Assessment & Prevention builds directly on the risks identified in Tool 9 and feeds prioritized actions into Tool 10. It informs leadership decisions during management review (Tool 8) and ensures resources are allocated based on data rather than urgency. Without this step, organizations know their risks—but still pay for them later.
Apply the tool to current risks and improvement initiatives, use it to guide budget and project decisions, and revisit it as conditions change. Practitioner feedback continues to shape how this tool evolves.
Other Commonly Used Tools (and Their Limitations)
LogicManager
A risk management platform with assessment tools, heat maps, and project prioritization.
Strength: Robust analytics and enterprise scalability.
Limitation: Best suited for larger organizations with mature ERM programs.Resolver
A platform supporting risk intelligence, prevention planning, and resource allocation.
Strength: Strong action-oriented insights.
Limitation: Higher cost and broader system overhead.RiskWatch
A standards-aligned tool supporting risk analysis and prevention prioritization.
Strength: Configurable for ISO-based risk assessment.
Limitation: Initial setup and configuration effort.Camms.Risk
A compliance-focused platform with dashboards and workflow support.
Strength: User-friendly interface and integrated reporting.
Limitation: Subscription-based model and broader scope.

Pain Point 10 – An Overwhelmed Work Environment Where Actions Fall Through the Cracks
Many organizations hold management reviews and improvement discussions, yet struggle to consistently capture decisions, assign actions, and follow through. Reviews occur, notes are taken, and good intentions are expressed—but weeks later, actions are forgotten, priorities shift, and momentum is lost.
Many organizations hold management reviews and improvement discussions, yet struggle to consistently capture decisions, assign actions, and follow through. Reviews occur, notes are taken, and good intentions are expressed—but weeks later, actions are forgotten, priorities shift, and momentum is lost.
Why this matters
When actions from management reviews are not systematically tracked, reviewed, and closed, the management system stagnates. Issues resurface, risks remain unaddressed, and leadership engagement erodes. From a compliance standpoint, this often appears as ineffective management review outputs—particularly against requirements such as ISO 9001 Clause 9.3—resulting in repeat nonconformities or audit findings. From a business perspective, it leads to wasted meeting time, recurring problems, and missed improvement opportunities, especially as organizations grow more complex.
The better way
A centralized, visible system for capturing and managing actions—regardless of where they originate. By clearly documenting:
Review dates and discussion topics
Decisions and action items
Ownership, priority, and due dates
Status and follow-up
leadership reviews become drivers of change rather than calendar events. Accountability is clear, progress is visible, and improvement becomes part of normal operations.
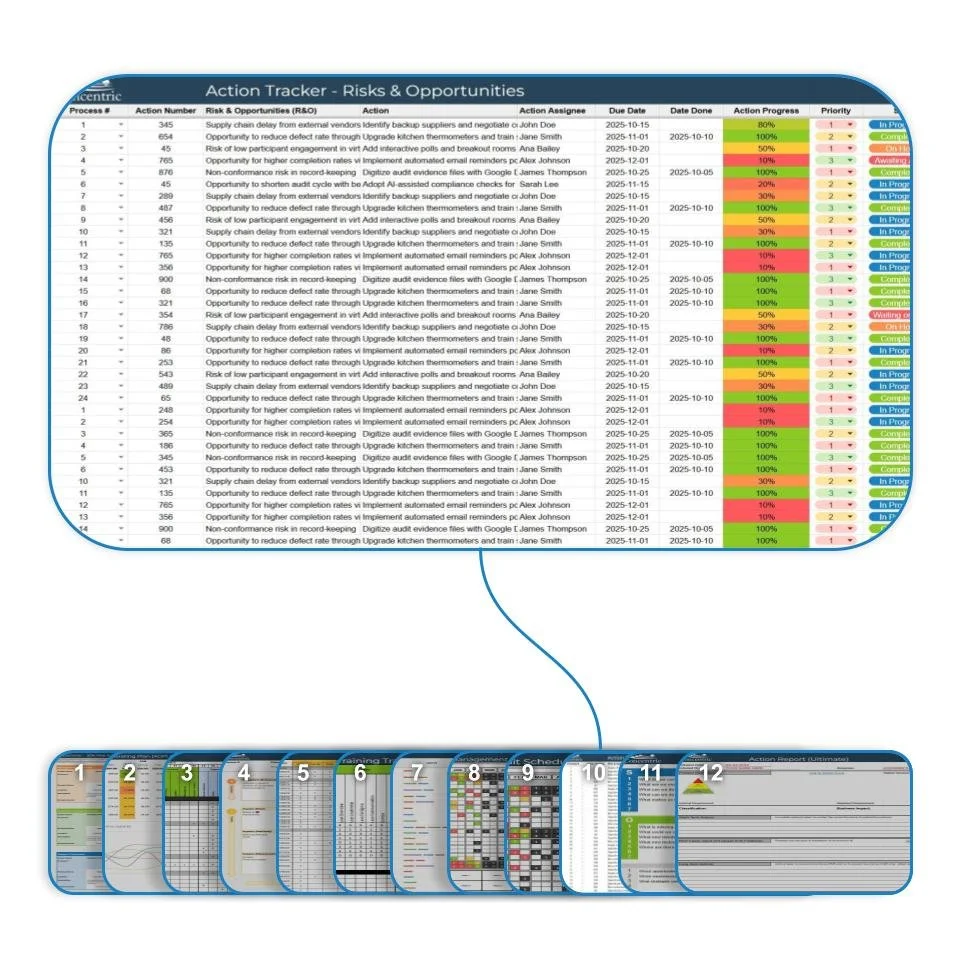
Tool 10: Action Tracker & Prioritization
The Action Tracker & Prioritization tool provides a single source of truth for managing actions generated from management reviews, audits, risk assessments, and day-to-day improvement activities. It ensures that decisions lead to execution and that commitments made by leadership are carried through to completion.
Built in a flexible, spreadsheet-based format, the tool supports scheduling, action ownership, prioritization, and status tracking in one integrated view. It is designed to link seamlessly with management review outputs, performance data, and corrective action activities. Refined through more than 15 years of real-world use, it scales easily while remaining simple enough to be used consistently.
This tool turns discussion into disciplined follow-through.
How Tool 10 Fits into the 12 Tools™ System
The Action Tracker is the connective tissue of the management system. It links leadership intent (Tool 9), performance data (Tool 7), risk (Tool 11), and corrective action (Tool 12) into a single execution mechanism. Without it, improvement efforts lose momentum and accountability fades.
Apply the tracker to your next management review, audit, or improvement initiative—and keep it visible. Share how you manage follow-up and prioritization in the forum below. Practitioner input continues to shape how this tool evolves.
Other Commonly Used Tools (and Their Limitations)
ISMS.online
A compliance-focused platform with built-in management review tracking and evidence linking.
Strength: Strong ISO documentation support.
Limitation: Heavily security-centric and less flexible outside ISMS contexts.Qualio
A quality management system with review logging and electronic approvals.
Strength: Streamlined documentation and e-signatures.
Limitation: More prescriptive and industry-specific.Ideagen
An enterprise-quality management platform with dashboards for action tracking.
Strength: Robust configuration and reporting.
Limitation: Best suited for larger organizations with dedicated system owners.ETQ Reliance
A QMS platform that assigns, tracks, and escalates actions tied to risk and compliance.
Strength: Strong integration with risk management.
Limitation: Setup and administration effort required.

Pain Point 8 – Underestimating Organizational Risks and Opportunities
Many organizations address risks only after something goes wrong—or rely on informal knowledge held by a few individuals. At the same time, opportunities for improvement, efficiency, or growth are rarely evaluated with the same discipline as risks. Without a structured approach, both threats and opportunities remain reactive and inconsistent.
Many organizations address risks only after something goes wrong—or rely on informal knowledge held by a few individuals. At the same time, opportunities for improvement, efficiency, or growth are rarely evaluated with the same discipline as risks. Without a structured approach, both threats and opportunities remain reactive and inconsistent.
Why this matters
When risks and opportunities are not systematically identified, evaluated, and tracked, organizations are left vulnerable to surprises. Audit failures, operational disruptions, and recurring issues emerge without warning, often tied to weak alignment with requirements such as ISO 9001 Clause 6.1. Equally important, opportunities to improve performance, reduce cost, or strengthen the system are overlooked. From a business perspective, this leads to constant firefighting, missed strategic advantages, and reduced confidence in leadership decision-making.
The better way
A structured, living register that makes risks and opportunities visible, prioritized, and actionable. By consistently:
Identifying risks and opportunities across processes and objectives
Assessing likelihood and impact
Prioritizing based on business relevance
Assigning ownership and actions
Organizations move from reactive response to proactive management. Risk becomes something that is anticipated and managed—not feared.
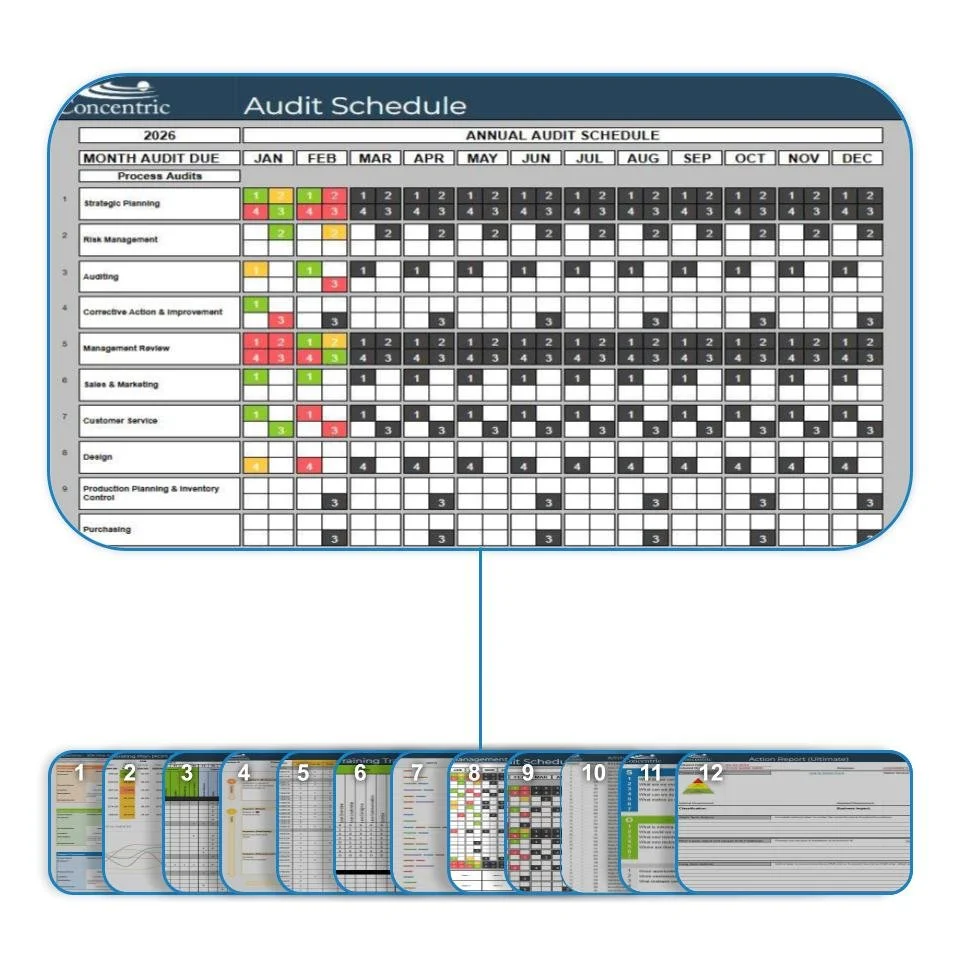
Tool 8: Annual Audit Schedule
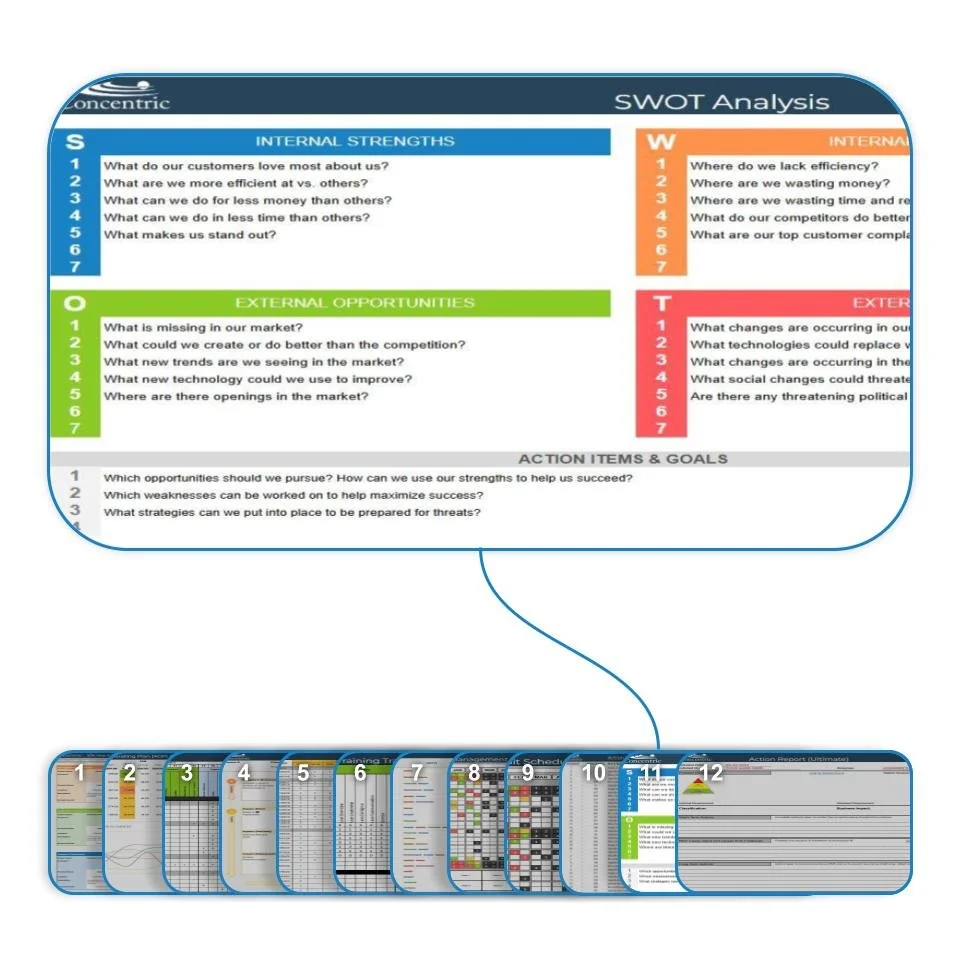
The Risk & Opportunities Register provides a centralized, structured approach to managing uncertainty and improvement potential within the management system. It captures risks and opportunities in a single, integrated view—supporting evaluation, prioritization, and action tracking.
Built in a flexible, spreadsheet-based format, the tool supports multiple assessment methods, including SWOT and FMEA-style analysis, along with scoring and prioritization. It links directly to objectives, processes, audits, and corrective actions, ensuring risks and opportunities are addressed where they matter most. Refined through more than 15 years of real-world application, it enables organizations to manage uncertainty without unnecessary complexity.
This tool transforms risk management into informed decision-making.
How Tool 8 Fits into the 12 Tools™ System
The Risk & Opportunities Register connects strategy (Tool 2), performance data (Tool 7), audits (Tool 6), and corrective actions (Tool 12) into a proactive planning mechanism. It ensures that risks inform priorities and that opportunities are intentionally pursued—not accidentally discovered.
Apply the register to your current objectives and processes, review it regularly in management review, and keep it current as conditions change. Practitioner feedback continues to shape how this tool evolves.
Other Commonly Used Tools (and Their Limitations)
Resolver
A risk management platform with scoring, reporting, and audit integration.
Strength: Strong analytics and audit linkage.
Limitation: Higher cost and enterprise-level overhead.RiskWatch
A tool supporting ISO-aligned assessments, including FMEA and prioritization.
Strength: Configurable for standards-based risk analysis.
Limitation: Initial setup effort required.LogicManager
An enterprise risk platform with heat maps and centralized registers.
Strength: Scalable and comprehensive risk tracking.
Limitation: Best suited for larger organizations with mature ERM programs.Camms.Risk
A compliance-focused platform with dashboards and workflows.
Strength: User-friendly interface and structured workflows.
Limitation: Subscription model and broader system scope.

Pain Point 9 – Ineffective Leadership Reviews Due to Lack of Structure
Many organizations hold management reviews, but without a consistent agenda or defined outputs, those meetings often become unfocused discussions. Topics vary from meeting to meeting, data is reviewed inconsistently, and important inputs—such as audit results, performance trends, or risks—are overlooked or rushed.
Many organizations hold management reviews, but without a consistent agenda or defined outputs, those meetings often become unfocused discussions. Topics vary from meeting to meeting, data is reviewed inconsistently, and important inputs—such as audit results, performance trends, or risks—are overlooked or rushed.
Why this matters
When management reviews lack structure, leadership cannot reliably assess the effectiveness of the management system. Required inputs and outputs are missed, decisions are not clearly documented, and actions are inconsistently defined. From a compliance perspective, this frequently results in nonconformities against requirements such as ISO 9001 Clause 9.3. From a business perspective, it leads to wasted meeting time, unclear direction, stalled improvement efforts, and accountability gaps at the leadership level.
The better way
A consistent, repeatable management review structure that ensures the right topics are covered every time—and that decisions are clearly captured. With a structured agenda and standardized minutes:
Leadership reviews remain focused and efficient
Required inputs (metrics, audits, risks, objectives) are consistently addressed
Outputs such as decisions, priorities, and actions are clearly documented
Reviews drive alignment and improvement rather than discussion alone
This transforms management review from a compliance obligation into a leadership tool.
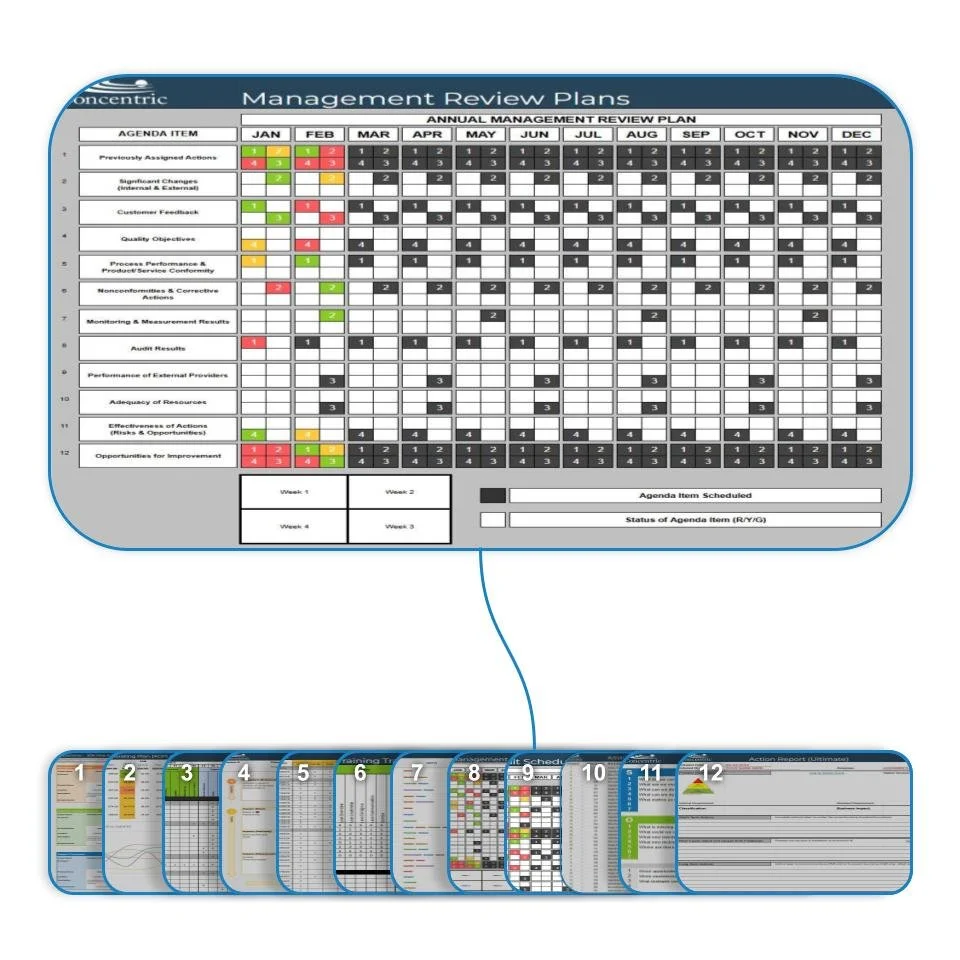
Tool 9: Management Review Agenda & Minutes Template
The Management Review Agenda & Minutes Template provides a clear, ISO-aligned structure for planning and documenting management reviews. It ensures that required inputs are systematically reviewed and that outcomes—decisions, priorities, and action items—are clearly recorded.
Built in a flexible, document-based format, the tool supports pre-populated agenda sections linked to performance data, audits, risks, and objectives. It also provides structured space for capturing conclusions and next steps, creating a consistent record of leadership oversight. Refined through more than 15 years of real-world application, the template balances discipline with practicality—making reviews both efficient and effective.
This tool ensures leadership conversations lead to clarity, not ambiguity.
How Tool 9 Fits into the 12 Tools™ System
The Management Review Agenda & Minutes Template brings together inputs from across the system—performance metrics (Tool 7), audits (Tool 6), risks (Tool 11), and objectives (Tool 2)—into a single leadership forum. It creates the structure required for effective oversight, while Tool 10 ensures that resulting actions are executed and tracked.
Apply the template to your next management review, tailor it to your organization’s scope, and keep it consistent. Share your agenda refinements and lessons learned in the forum below—practitioner input continues to strengthen the system.
Other Commonly Used Tools (and Their Limitations)
ISMS.online
A compliance-focused platform with management review workflows and reminders.
Strength: Strong traceability to ISO requirements.
Limitation: Heavily oriented toward information security systems.Qualio
A quality management platform offering review templates and electronic approvals.
Strength: Streamlined documentation and sign-off.
Limitation: More prescriptive and industry-specific.Hyperproof
A compliance management platform with real-time reporting for leadership reviews.
Strength: Data-driven insights across compliance domains.
Limitation: Broader scope may add complexity for quality-focused systems.Sprinto
An automation-focused compliance tool supporting review workflows and evidence tracking.
Strength: Accelerates audit preparation.
Limitation: Primarily geared toward SOC 2 and security-driven frameworks.

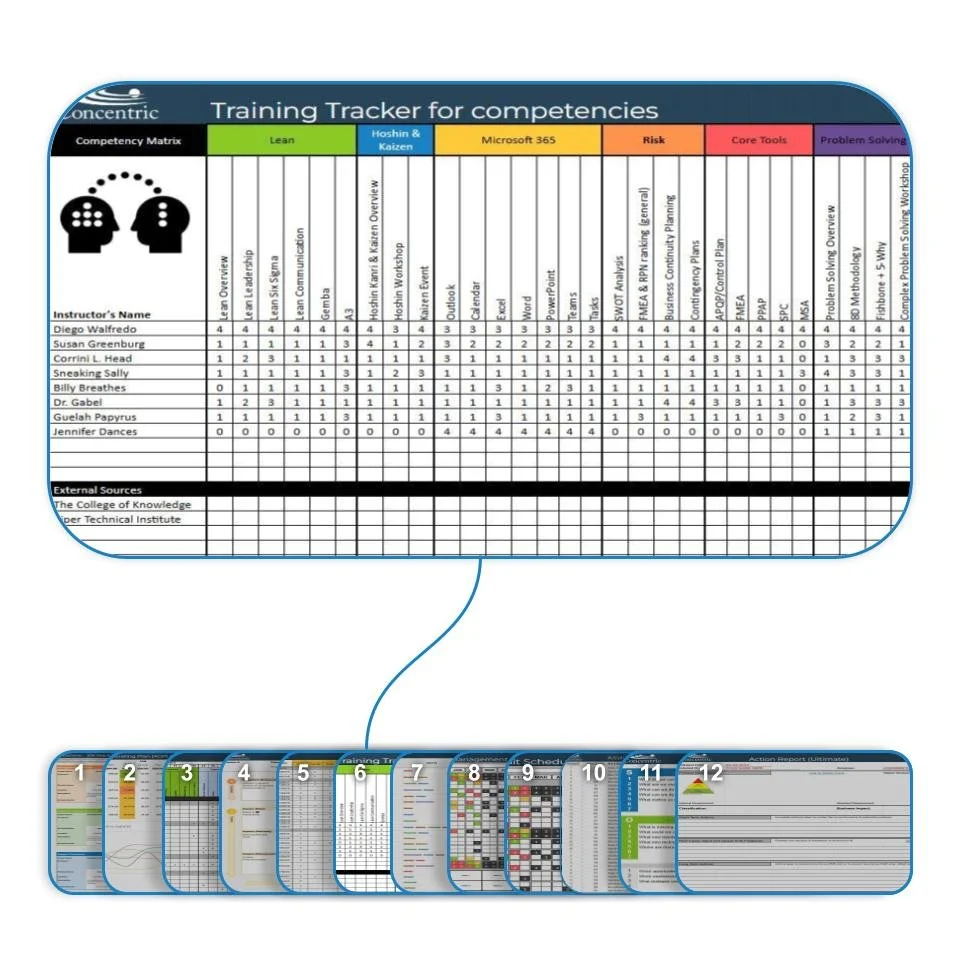
Pain Point 7 – Lack of Team-Based Performance Measurement
Many organizations collect performance data but struggle to use it effectively. Metrics are scattered across spreadsheets, reviewed inconsistently, or surfaced too late to influence decisions. As a result, teams operate reactively, and leaders lack timely insight into whether processes are performing as intended.
Many organizations collect performance data but struggle to use it effectively. Metrics are scattered across spreadsheets, reviewed inconsistently, or surfaced too late to influence decisions. As a result, teams operate reactively, and leaders lack timely insight into whether processes are performing as intended.
Why this matters
When performance measures are not clearly defined, visible, and reviewed at the right level, early warning signs are missed. Issues escalate before they are addressed, opportunities for improvement go unnoticed, and decision-making becomes reactive rather than proactive. From a compliance perspective, this frequently shows up as weak monitoring and measurement practices—particularly against requirements such as ISO 9001 Clause 9.1—leading to audit findings, inefficiencies, and unnecessary corrective actions. From a business standpoint, it results in slower response times, wasted effort, and inconsistent results.
The better way
A clear, team-focused performance dashboard that makes key process measures visible and actionable. By consolidating KPIs into a single, dynamic view:
Teams can see how their processes are performing in real time
Trends and risks are identified earlier
Data-driven decisions become part of daily operations
Performance monitoring supports improvement rather than compliance alone
When measures are visible and meaningful, accountability and improvement follow naturally.
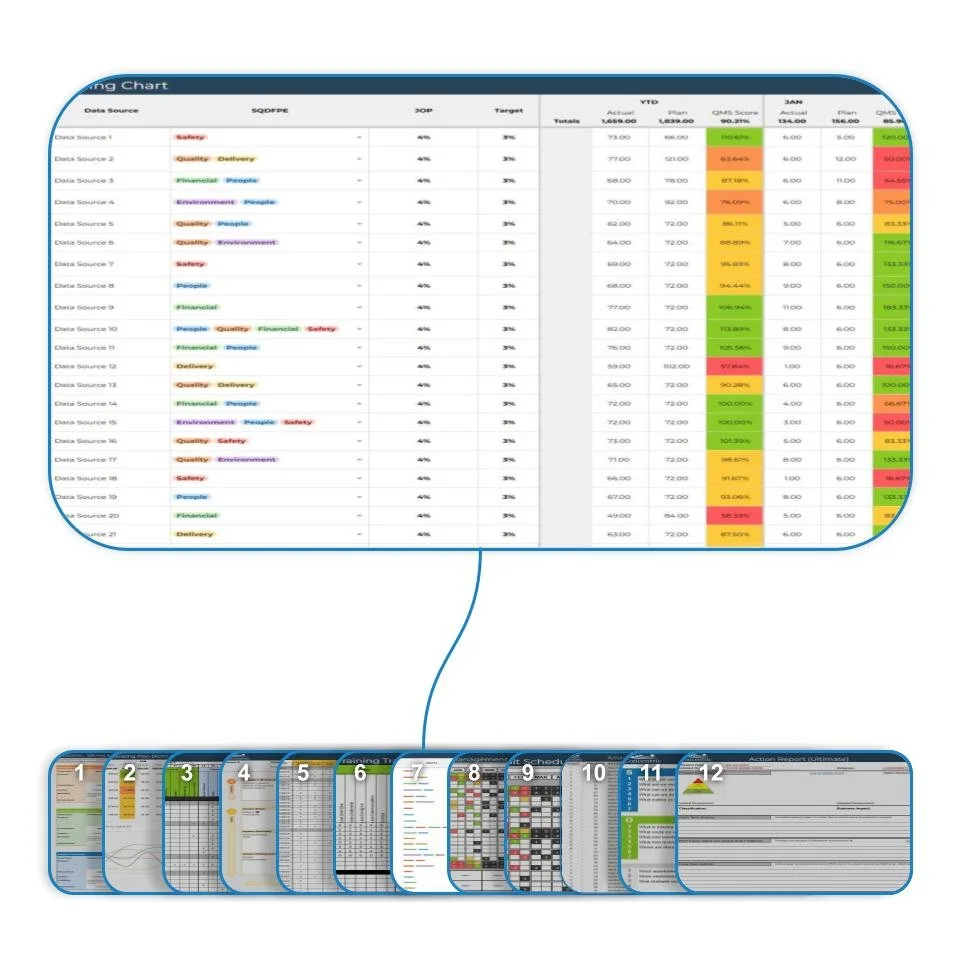
Tool 7: Process Measures Dashboard
The Process Measures Dashboard provides a real-time, visual view of key performance indicators tied directly to organizational and process-level objectives. Designed to support team-based ownership, it brings together metrics, targets, and trends in a single, easy-to-understand format.
Built in a flexible, spreadsheet-based environment, the dashboard balances simplicity with functionality. It supports automated updates, customizable visuals, and direct linkage to process definitions, goals, and audit activities. Developed and refined through more than 15 years of practical use, the tool enables organizations to monitor performance without overwhelming teams with data.
This tool turns measurement into insight—and insight into action.
How Tool 7 Fits into the 12 Tools™ System
The Process Measures Dashboard connects planning and execution. It draws directly from the goals defined in Tool 2 and the processes documented in Tool 4, providing the data needed to support audits, management review, risk assessment, and corrective action. Without visible performance measures, improvement efforts lack direction and credibility.
Apply the dashboard to a critical process, refine the measures with your team, and share what works. The 12 Tools™ Methodology grows stronger through real-world application and practitioner insight.
Other Commonly Used Tools (and Their Limitations)
Google Looker Studio
A free platform for building dashboards and visualizing data in real time.
Strength: Strong integration with Google tools.
Limitation: General-purpose analytics with limited alignment to ISO-based management systems.Tableau
A powerful analytics tool for advanced visualizations and trend analysis.
Strength: Highly flexible and visually rich dashboards.
Limitation: Higher cost and learning curve for everyday operational use.Microsoft Power BI
A business intelligence platform for real-time dashboards and reporting.
Strength: Robust data connectivity and enterprise scalability.
Limitation: Best suited for Microsoft-centric environments and dedicated BI support.Klipfolio
A cloud-based KPI monitoring tool with alerts and integrations.
Strength: Accessible option for team-level dashboards.
Limitation: Setup can become complex as metrics and dependencies grow.

Pain Point 6 – Uncoordinated or Inconsistent Auditing Activities
Many organizations approach internal audits reactively. Schedules slip, scope changes at the last minute, and coverage depends on availability rather than risk or performance. What should be a disciplined management activity often becomes a compliance scramble.
Many organizations approach internal audits reactively. Schedules slip, scope changes at the last minute, and coverage depends on availability rather than risk or performance. What should be a disciplined management activity often becomes a compliance scramble.
Why this matters
When internal audits are not planned, scheduled, and tracked systematically, key risks are missed and coverage becomes inconsistent. This frequently leads to audit surprises, repeat findings, and nonconformities against requirements such as ISO 9001 Clause 9.2. From a business perspective, poor audit discipline drains time and resources, creates unnecessary rework, and weakens confidence in the management system—particularly in growing organizations or those operating across multiple processes or sites.
The better way
A structured internal audit program that is planned intentionally, executed consistently, and reviewed regularly. By clearly defining:
Audit scope and frequency
Risk- and performance-based priorities
Auditor assignments and responsibilities
Status, findings, and follow-up
audits shift from reactive events to proactive tools for improvement. Issues are identified earlier, corrective actions are more focused, and external audits become far more predictable.
Tool 6: Internal Audit Program & Schedule
The Internal Audit Program & Schedule provides a centralized, structured approach to planning and managing internal audits. It enables organizations to define audit scope, frequency, and ownership while tracking execution and completion in a single, visible system.
Built in a flexible, spreadsheet-based format, the tool supports risk-based scheduling, automation, and easy updates as priorities change. It integrates directly with process definitions, performance metrics, corrective actions, and management review. Refined through more than 15 years of real-world application, it allows organizations to maintain audit discipline without adding unnecessary administrative burden.
This tool turns internal audits into a consistent source of insight—not disruption.
How Tool 6 Fits into the 12 Tools™ System
The Internal Audit Program connects performance monitoring (Tool 7), risk assessment (Tool 11), and corrective action (Tool 12) into a closed-loop improvement system. It validates whether processes are working as intended and whether controls remain effective over time. Without a disciplined audit program, improvement efforts lack independent verification.
Apply the program to your current audit cycle, adjust priorities based on risk and performance, and keep it visible. Practitioner input continues to shape how this tool evolves.
Other Commonly Used Tools (and Their Limitations)
AuditBoard
A cloud-based platform for automating audit planning, execution, and reporting.
Strength: Strong risk-based workflows and reporting.
Limitation: Typically better suited for larger enterprises.TeamMate+
An audit management solution for scheduling audits and managing teams.
Strength: Robust integration with audit standards and methodologies.
Limitation: Initial learning curve and configuration effort.Ideagen
A quality-focused platform with internal audit scheduling and reminders.
Strength: ISO-aligned structure and compliance focus.
Limitation: Higher cost and broader system overhead.HighBond
A governance, risk, and compliance system for centralizing audit programs with analytics.
Strength: Data-driven insights and scalability.
Limitation: Can be complex for teams new to formal audit programs.

Pain Point 5 – Document and Record Management Chaos
As organizations grow, documents and records multiply quickly. Procedures, forms, records, and evidence are stored in multiple locations, maintained by different owners, and updated at different times. Over time, it becomes increasingly difficult to know which version is current, where records reside, and how long information must be retained.
As organizations grow, documents and records multiply quickly. Procedures, forms, records, and evidence are stored in multiple locations, maintained by different owners, and updated at different times. Over time, it becomes increasingly difficult to know which version is current, where records reside, and how long information must be retained.
Why this matters
When document and record control is weak, outdated instructions are unintentionally used, critical records cannot be retrieved during audits, and compliance risks increase. From an ISO perspective, this frequently appears as nonconformities against requirements such as ISO 9001 Clause 7.5—missing records, uncontrolled documents, or unclear retention practices. From a business standpoint, the impact includes wasted time searching for information, inconsistent execution, legal exposure, and growing frustration across teams.
The better way
A single, structured view of all documents and records that matter to the management system. By clearly defining:
What documents and records exist
Where they are stored
Who owns and maintains them
Revision status and retention requirements
organizations gain immediate visibility and control. Audits become faster and more predictable, teams trust the information they use, and the system scales without becoming unmanageable.
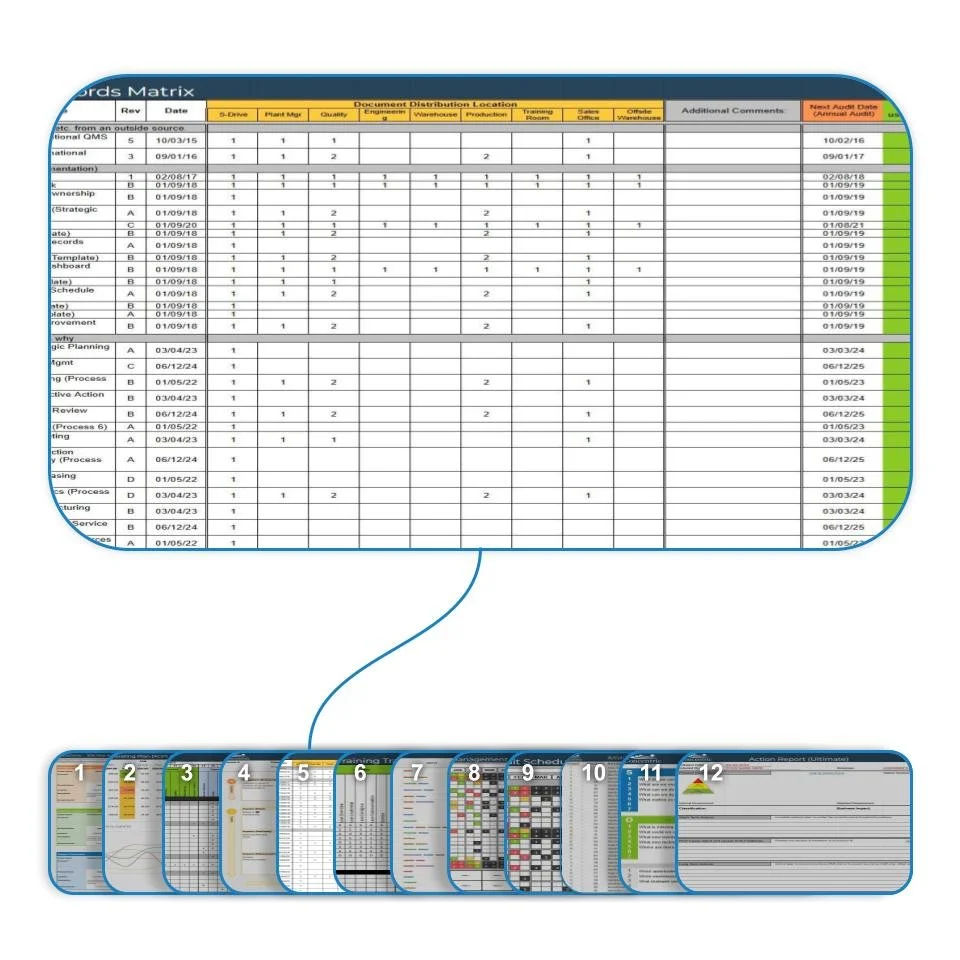
Tool 5: Master Document & Records Matrix
The Master Document & Records Matrix provides a centralized, system-level inventory of all controlled documents and required records. Using a clear, grid-based format, it captures ownership, storage location, revision status, and retention requirements in one place—creating a single source of truth for document control.
Built in a flexible, spreadsheet-based environment, the tool supports automation, filtering, and easy updates as documents change or new requirements are introduced. It integrates directly with process maps, training requirements, audits, and corrective actions. Refined through more than 15 years of real-world use, it enables organizations to maintain audit readiness without excessive administrative burden.
This tool turns document control from a recurring problem into a stable foundation.
How Tool 5 Fits into the 12 Tools™ System
The Master Document & Records Matrix supports every other tool in the system. It links process definitions (Tool 4), training requirements (Tool 6), audits (Tool 8), and corrective actions (Tool 12) to controlled information and evidence. Without reliable document and record control, consistency and compliance cannot be sustained.
Apply the matrix to your existing document set, validate ownership and retention, and keep it current as the system evolves. Practitioner feedback continues to inform how this tool is refined and improved.
Other Commonly Used Tools (and Their Limitations)
MasterControl
An ISO-focused quality management platform with advanced document routing and audit trails.
Strength: Strong compliance reporting and traceability.
Limitation: Higher cost and system overhead for advanced functionality.Qualio
A QMS platform that supports document matrices, approvals, and collaboration.
Strength: Streamlined workflows and electronic signatures.
Limitation: More tailored to specific regulated industries.QT9 QMS
A cost-effective solution for document control and ISO workflows.
Strength: User-friendly for manufacturing environments.
Limitation: Less flexible for non-manufacturing or multi-standard systems.M-Files
A metadata-driven document management system with advanced search capabilities.
Strength: Powerful classification and retrieval features.
Limitation: Steeper setup and configuration effort.

Pain Point 4 – Poorly Defined Process Controls and Variation in Execution
Many organizations operate processes that are understood informally but rarely defined in a consistent, structured way. Inputs, outputs, controls, roles, and measurements exist—but not in one clear, shared view. As a result, processes feel like a black box: people know work is happening, but not always how or why outcomes vary.
Many organizations operate processes that are understood informally but rarely defined in a consistent, structured way. Inputs, outputs, controls, roles, and measurements exist—but not in one clear, shared view. As a result, processes feel like a black box: people know work is happening, but not always how or why outcomes vary.
Why this matters
When individual processes are not clearly defined and controlled, risks remain hidden until they surface as defects, customer complaints, or audit findings. Teams spend time reacting instead of preventing problems, and process performance varies depending on who is doing the work. From a compliance standpoint, this often leads to nonconformities tied to weak process controls, unclear responsibilities, or ineffective monitoring—particularly under standards such as ISO 9001. From a business perspective, it results in inefficiency, rework, higher costs, and difficulty scaling.
The better way
A simple, one-page process definition that makes the critical elements of work visible and understandable. By clearly documenting:
Inputs and outputs
Roles and responsibilities
Controls and supporting resources
Performance measures
processes become repeatable, predictable, and improvable. Risks are identified earlier, variation is reduced, and audits become a validation exercise rather than a discovery mission.
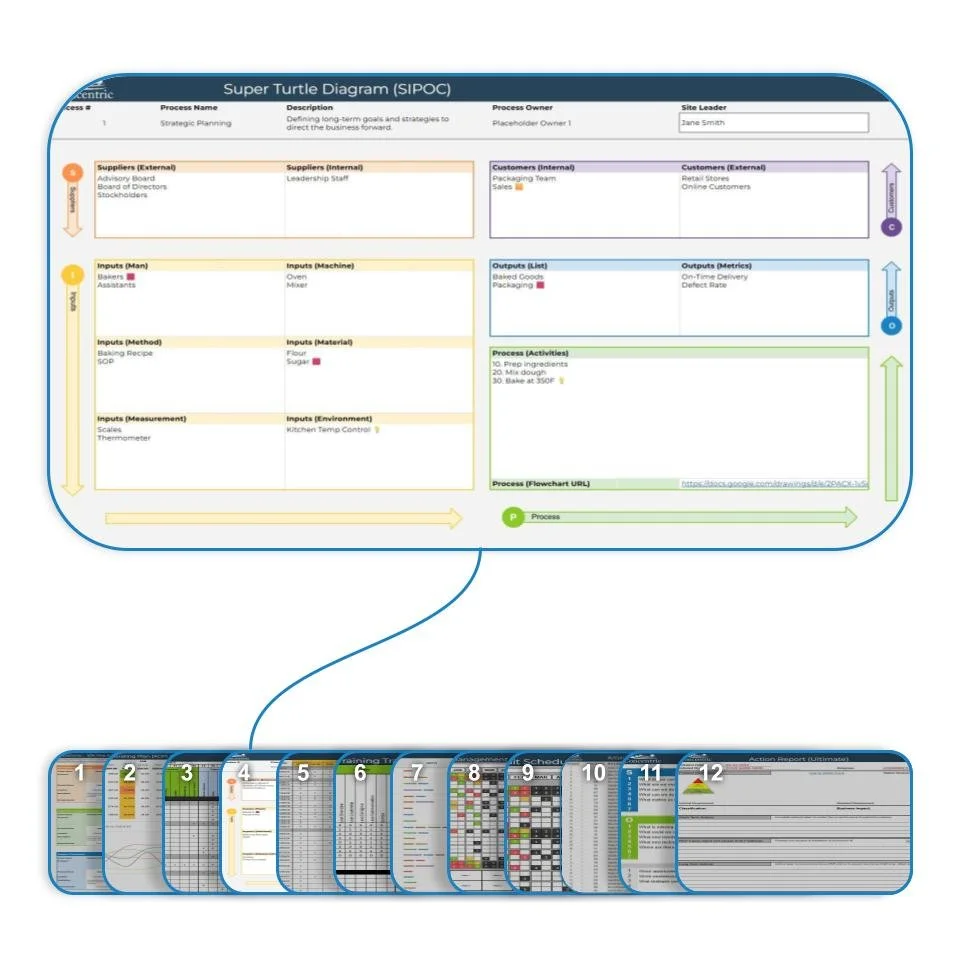
Tool 4: Turtle Diagram (5K Process Map)
The Turtle Diagram (5K Process Map) provides a focused, structured view of an individual process. Using a clear, visual format, it captures everything needed to control and manage a process on a single page—what is done, who does it, with what inputs and resources, under what controls, and how performance is measured.
Implemented in a flexible, spreadsheet-based format, the tool balances visual clarity with data-driven structure. It is easy to maintain, link to supporting documents and metrics, and integrate with downstream tools such as audits, risk assessments, and performance dashboards. Refined through more than 15 years of real-world application, it enables organizations to standardize execution without adding unnecessary complexity.
This tool is where strategy and structure meet daily work.
How Tool 4 Fits into the 12 Tools™ System
The Turtle Diagram builds on the organizational clarity established in Tools 1–3 by defining how work is actually performed. It provides the operational detail required to support performance measurement, risk assessment, auditing, and corrective action. Without this level of clarity, higher-level plans and metrics lack a stable foundation.
Apply the tool to a critical process, refine it with your team, and share what you learn. The strength of the 12 Tools™ Methodology comes from consistent structure informed by real operational experience.
Other Commonly Used Tools (and Their Limitations)
SIPOC Diagram
A high-level method for identifying suppliers, inputs, process steps, outputs, and customers.
Strength: Quick way to frame process boundaries.
Limitation: Lacks detail on controls, roles, and performance measures.Lucidchart
A collaborative platform for creating custom process diagrams.
Strength: Intuitive visuals and real-time collaboration.
Limitation: General-purpose tool not structured for formal process control.Microsoft Visio
A robust solution for detailed flowcharts and process models.
Strength: High level of customization.
Limitation: Steeper learning curve and heavier administrative effort.Miro
A digital whiteboard used for collaborative mapping and workshops.
Strength: Excellent for team engagement and ideation.
Limitation: Less disciplined structure for compliance-focused process control.

Pain Point 3 – Difficulty Identifying Who’s Covering What
Organizations often struggle to clearly determine which external standards, customer requirements, and internal policies apply to each process. Standards such as ISO 9001 contain numerous clauses, and without a structured method to assess applicability, teams are left interpreting requirements inconsistently or relying on institutional knowledge.
Organizations often struggle to clearly determine which external standards, customer requirements, and internal policies apply to each process. Standards such as ISO 9001 contain numerous clauses, and without a structured method to assess applicability, teams are left interpreting requirements inconsistently or relying on institutional knowledge.
Why this matters
When applicability is unclear, organizations either miss required controls or invest time and resources addressing requirements that do not apply. This creates compliance gaps, unnecessary complexity, and confusion across teams. During audits, these gaps surface as unclear scope, inconsistent implementation, or missing evidence. From a business perspective, the result is wasted effort, delayed certifications, increased audit findings, and frustration among process owners who are unsure of expectations.
The better way
A clear, structured method for determining and documenting applicability. By systematically mapping requirements to processes, organizations can:
Clearly define which clauses apply and why
Identify gaps before audits occur
Align process owners around shared expectations
Maintain consistency as standards, processes, or scope change
With this approach, compliance becomes deliberate and efficient rather than reactive.
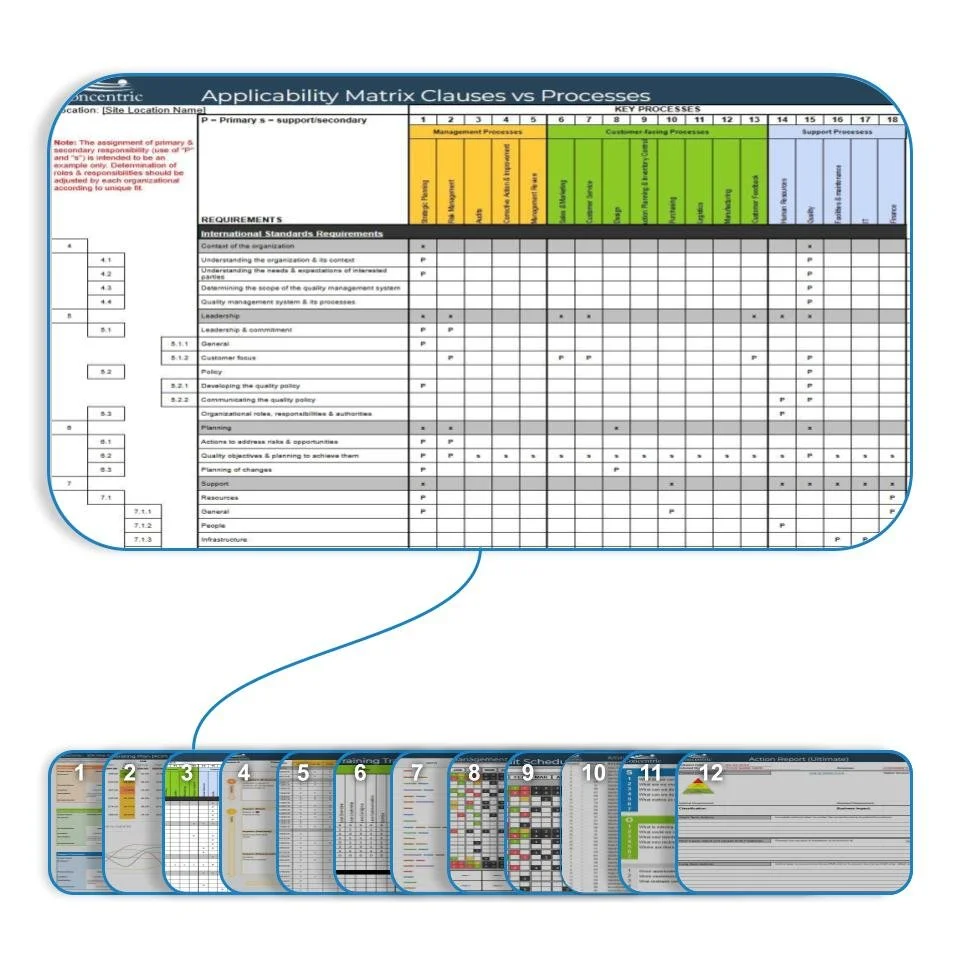
Tool 3: Applicability Matrices
The Applicability Matrices provide a structured, scalable way to map external and internal requirements directly to organizational processes. Using a clear, grid-based format, the tool documents which clauses apply, where they are addressed, and where gaps exist—creating immediate visibility and traceability.
Built in a flexible, spreadsheet-based environment, the tool supports customization across multiple standards (such as ISO 9001, IATF 16949, or customer-specific requirements). It enables easy updates, filtering, and export for audits, while linking seamlessly to process maps, risk assessments, and corrective actions. Refined through more than 30 years of real-world application, it ensures comprehensive coverage without unnecessary complexity.
This tool removes guesswork and replaces it with clarity.
How Tool 3 Fits into the 12 Tools™ System
The Applicability Matrices connect organizational intent to operational reality. Building on the system scope defined in Tool 1 and supporting the process clarity established in Tool 4, this tool ensures that every applicable requirement is clearly understood, owned, and addressed. It forms the backbone of audit readiness, risk identification, and corrective action.
Apply the matrix to a new or existing standard, validate it with process owners, and keep it current as your system evolves. Practitioner feedback continues to shape how this tool is refined and improved.
Other Commonly Used Tools (and Their Limitations)
MasterControl
A quality management platform with automated compliance matrices and audit traceability.
Strength: Strong requirement linking and reporting.
Limitation: Higher cost and broader system overhead.ETQ Reliance
A configurable quality and risk management platform.
Strength: Flexible matrix and analytics capabilities.
Limitation: Initial setup and configuration effort required.Qualio
An electronic QMS focused on requirement traceability and collaboration.
Strength: User-friendly interface and collaboration features.
Limitation: More heavily oriented toward regulated industries.Intelex
An EHSQ platform with dashboards for applicability mapping and gap analysis.
Strength: Cloud-based scalability across disciplines.
Limitation: Broader scope beyond quality and compliance may add complexity.

Pain Point 2 – Inability to Translate Strategy into Actionable Goals
Organizations routinely define strategic objectives—growth targets, quality goals, compliance commitments—but struggle to convert those intentions into clear, measurable plans that teams can execute. As goals move down through the organization, alignment erodes, priorities blur, and “strategy” becomes disconnected from day-to-day work.
Organizations routinely define strategic objectives—growth targets, quality goals, compliance commitments—but struggle to convert those intentions into clear, measurable plans that teams can execute. As goals move down through the organization, alignment erodes, priorities blur, and “strategy” becomes disconnected from day-to-day work.
Why this matters
When strategic objectives are not broken down into actionable, measurable goals, teams work hard but not always in the right direction. Resources are consumed by well-intended but misaligned initiatives, progress becomes difficult to assess, and leadership lacks objective evidence that plans are being executed. From a compliance perspective, this gap frequently appears as weak or non-measurable quality objectives, poor linkage between leadership intent and operational plans, and audit findings tied to ineffective planning and monitoring.
The better way
A clear, visual structure that cascades strategy into aligned goals at every level of the organization. A well-designed goal tree connects high-level business objectives to functional and team-level plans, complete with measurable targets, owners, and timelines. With this approach:
Strategy is clearly understood across the organization
Teams know how their work supports business objectives
Progress is visible and measurable
Compliance becomes an outcome of disciplined execution, not a separate effort
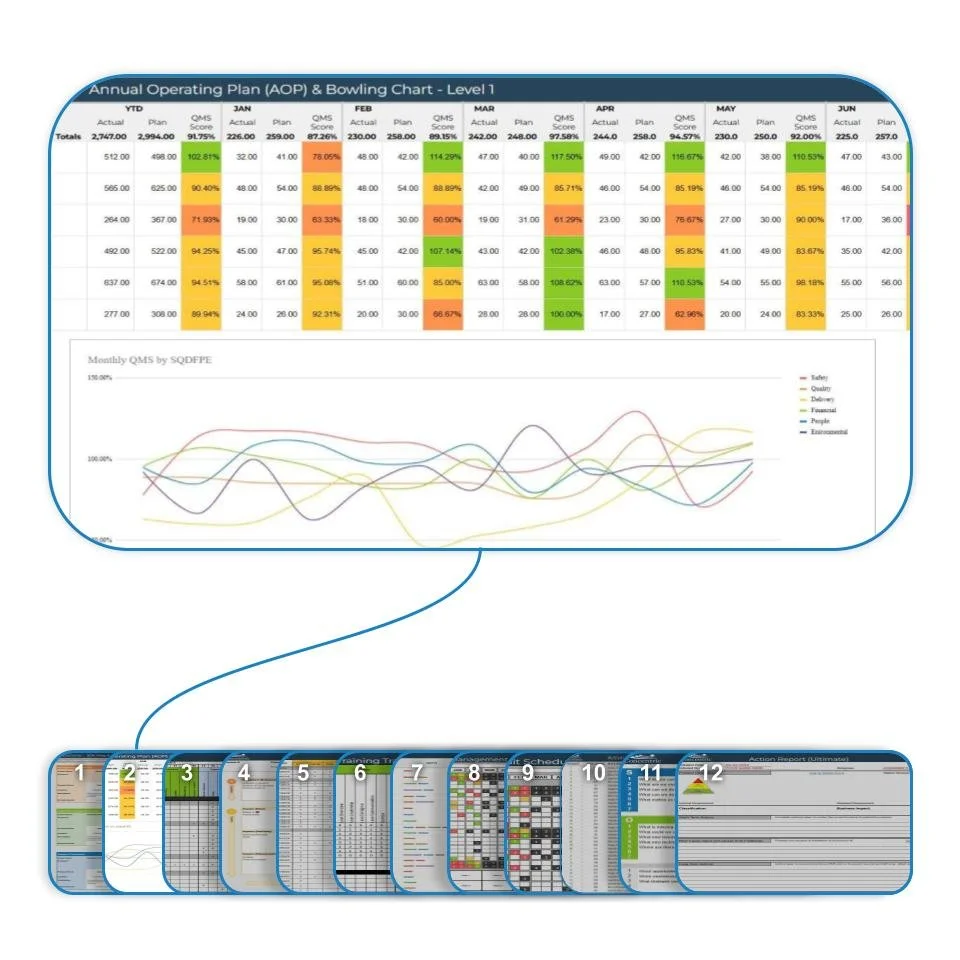
Tool 2: Goal Tree & Annual Operating Plan (AOP)
The Goal Tree & Annual Operating Plan (AOP) transforms strategic intent into an executable plan. It provides a structured, visual method for breaking down business goals into measurable objectives by function and team—while maintaining clear alignment to the organization’s strategy.
Built in an interactive, spreadsheet-based format, the tool combines goal hierarchy, KPI definition, ownership, and timelines into a single, integrated system. It is designed to support annual planning while remaining flexible enough to adapt as priorities shift throughout the year. Refined through more than 15 years of practical application, it serves as the planning backbone of the 12 Tools™ Methodology and integrates directly with performance metrics, audits, and management review.
This tool ensures that planning is not just documented—but executed.
How Tool 2 Fits into the 12 Tools™ System
The Goal Tree & AOP builds directly on the organizational clarity established in Tool 1. Once processes and ownership are defined, this tool translates strategy into actionable plans that drive execution, measurement, and accountability. Downstream tools—process measures, audits, and management review—depend on this alignment to be effective.
Explore the tool, apply it to your current planning cycle, and share what works and what does not. The 12 Tools™ Methodology is continuously shaped by real-world use and practitioner feedback.
Other Commonly Used Tools (and Their Limitations)
Weekdone
An OKR-focused platform for aligning team goals with company objectives.
Strength: Simple goal alignment and weekly check-ins.
Limitation: Limited focus on ISO-aligned planning and compliance integration.AchieveIt
A strategic execution platform that visualizes goals and tracks progress through dashboards.
Strength: Strong support for annual strategic plans.
Limitation: Higher cost and complexity for smaller teams.ClearPoint Strategy
A balanced scorecard and strategy management tool with strong KPI reporting.
Strength: Robust metrics and reporting capabilities.
Limitation: Steeper learning curve and heavier administrative effort.Asana
A project and task management platform that links objectives to execution.
Strength: Broad collaboration and integration features.
Limitation: General-purpose tool not designed for structured AOP or compliance systems.

Pain Point 1 – Lack of Defining the Organization and Process Ownership
It all begins with an idea. Maybe Many organizations operate without a clear, shared understanding of how work actually flows across the business. Processes evolve organically, responsibilities shift over time, and interdependencies are assumed rather than documented. The result is a system where ownership is unclear and accountability is diffused—felt daily by leaders, process owners, and auditors alike.
It all begins with an idea. Maybe Many organizations operate without a clear, shared understanding of how work actually flows across the business. Processes evolve organically, responsibilities shift over time, and interdependencies are assumed rather than documented. The result is a system where ownership is unclear and accountability is diffused—felt daily by leaders, process owners, and auditors alike.
Why this matters
Without a complete, high-level view of the organization—including process scope, interactions, and ownership—teams operate in silos. Work is duplicated, critical handoffs are missed, and gaps remain hidden until something fails. From a compliance perspective, this often surfaces during audits as unclear scope, inconsistent process boundaries, or ownership disputes. From a business perspective, it translates into wasted effort, slower decision-making, increased risk, and missed opportunities to scale effectively.
The better way
A simple, scalable system-level map that defines what the organization does, how processes interact, and who owns them. With a clear 50,000-foot view:
Accountability becomes explicit
Cross-functional collaboration improves
Audit scope and system boundaries are immediately clear
The management system can grow and adapt without being rebuilt
This clarity becomes the foundation for every other improvement, control, and performance conversation.
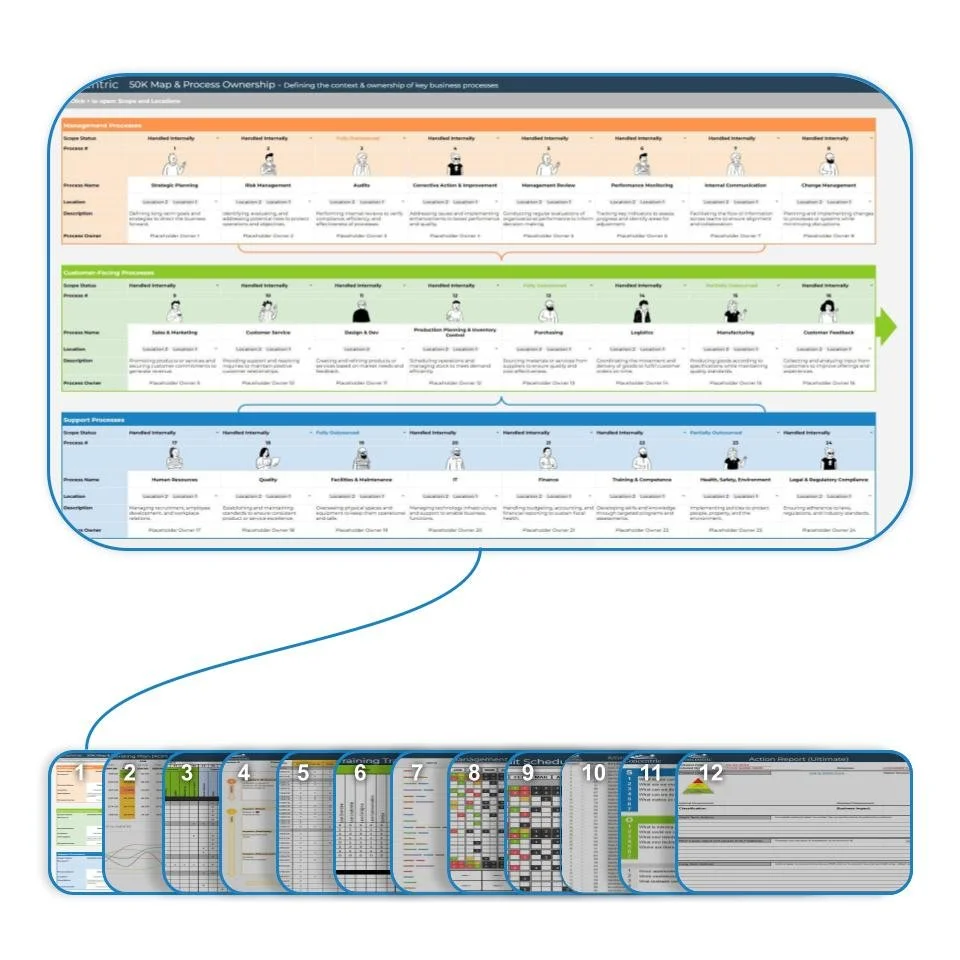
Tool 1: 50K Map of Processes & Ownership
The 50K Map of Processes & Ownership is the foundational tool of the 12 Tools™ Methodology. It provides a single, high-level view of the organization’s process architecture—clearly defining process scope, interdependencies, and ownership in one place.
Built in a dynamic, spreadsheet-based format, the tool combines clarity, structure, and flexibility. It is designed to be easily maintained, linked to downstream tools, and updated as the organization evolves. Developed and refined through more than 15 years of real-world use, it scales seamlessly from small organizations to complex, multi-site systems and serves as the backbone of the entire management system.
This tool does not replace visual process mapping—it anchors it. Everything else connects here.
How Tool 1 Fits into the 12 Tools™ System
The 50K Map is not an endpoint—it is the starting point. It defines the system that all other tools build upon, from applicability and process mapping to audits, metrics, and management review. Without it, the rest of the system lacks cohesion.
Explore the tool, contribute your perspective, and share how your organization defines ownership and scope. This system continues to evolve through real practitioner input—yours included.
Other Commonly Used Tools (and Their Limitations)
Lucidchart
A collaborative diagramming platform well-suited for visualizing processes quickly.
Strength: Intuitive and accessible.
Limitation: Lacks structured ownership and system-level compliance focus.Microsoft Visio
A powerful tool for detailed process modeling and data-linked diagrams.
Strength: Robust and enterprise-capable.
Limitation: Often overly complex for maintaining a high-level organizational view.Draw.io (diagrams.net)
A free, browser-based tool for flowcharts and simple diagrams.
Strength: Easy to start and cost-effective.
Limitation: Limited structure, automation, and system integration.Miro
An open, visual workspace for brainstorming and mapping relationships.
Strength: Excellent for workshops and ideation.
Limitation: Not designed for formal process ownership or compliance systems.